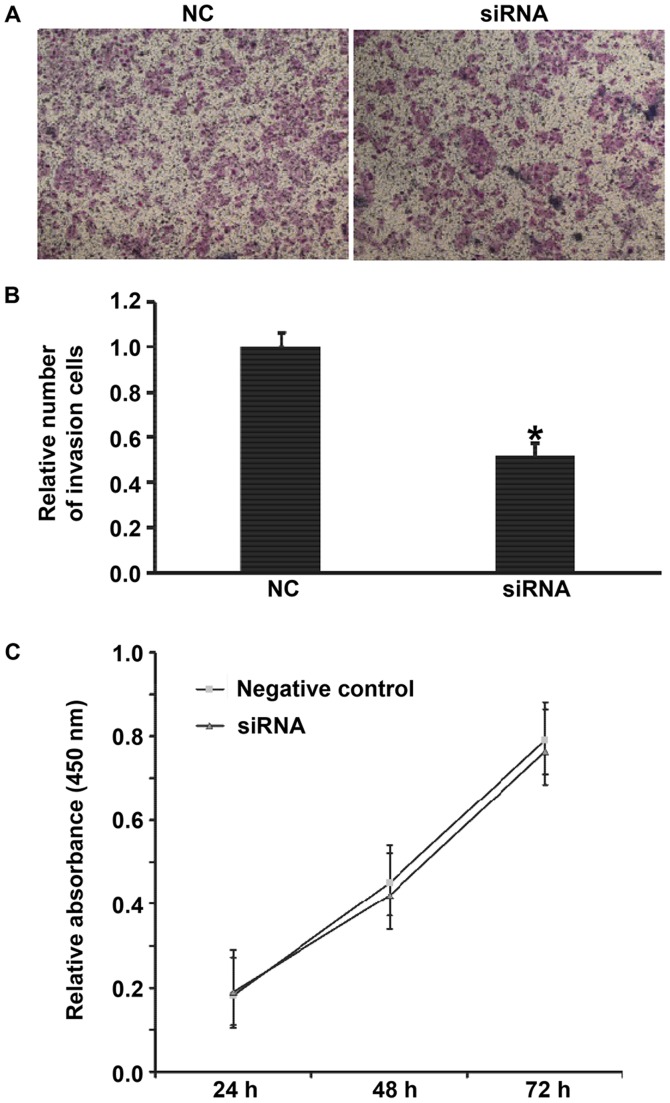
Figure 7.
Effect of siRNA of HPSE on the biological functions of BGC-823 cells. (A) Images of invasion cells that crossed chamber membrane. (B) Relative number of invasion cells transfected with NC or siRNA of HPSE. Transwell assay was used to determine the invasion ability of the cells. *P<0.01 compared with NC group. (C) Proliferation of BGC-823 cells at 24, 48 and 72 h after transfection with negative control (NC) or siRNA of HPSE. CCK-8 assay was used to determine the proliferation of the cells. Absorbance of each well was measured at 450 nm with a microplate reader and cell proliferation curves were plotted. *P<0.01 compared with NC group. si, small interferring; HPSE, heparanase; NC, negative control.

