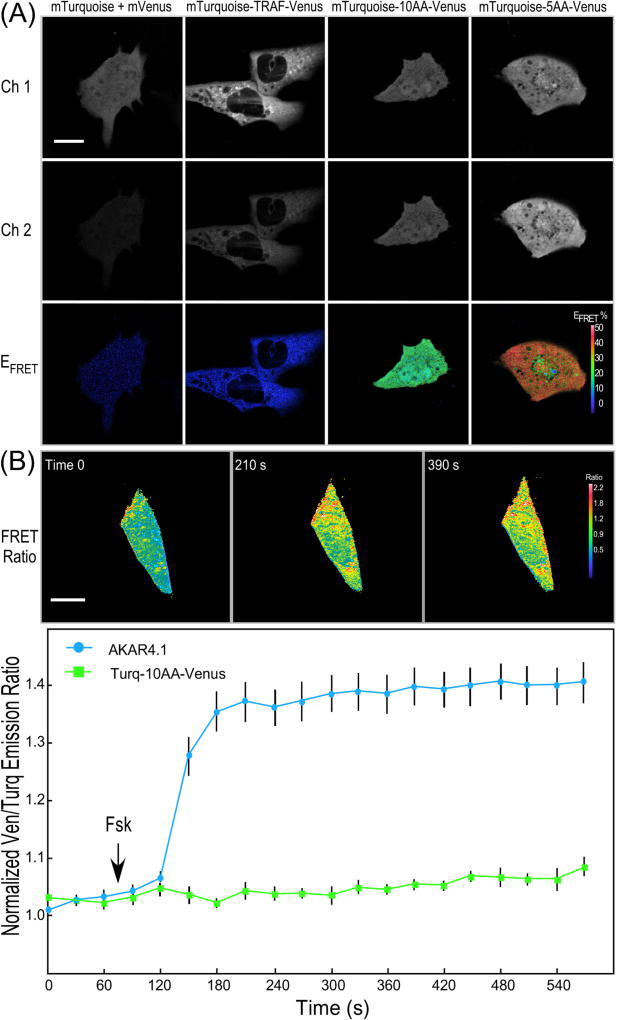
Fig. 2.
IVM ratiometric imaging of FRET standards and the AKAR4.1 biosensor. (A) Representative donor intensity (Ch. 1, 454–494 nm; scale bar is 10 µm), acceptor intensity (Ch. 2, 520–580 nm), and FRET efficiency (EFRET) was determined for HEK293 cells expressing the indicated FRET standard probes (scale bar is 10 µm and the look-up table indicates higher EFRET with warmer color). (B) Ratiometric measurements of the AKAR4.1 probe or the Turquoise-10AA-Venus FRET standard in living mouse cardiomyocytes. The cells were illuminated at 810 nm and the emission signals were simultaneously monitored in the donor (454–494 nm) and acceptor (520–580 nm) channels, and the FRET ratio was determined for a single cardiomyocyte at the indicated time points (scale bar is 10 µm and the look-up table indicates higher FRET ratio with warmer color). Ratiometric measurements show the rapid increase in the Ven/Turq ratio for the cells expressing AKAR4.1, but not the FRET standard over a 3-min time frame. The results for AKAR4.1 are from the 9 individual cells (±SE). [from Ref. [12]]. (For interpretation of the references to color in this figure legend, the reader is referred to the web version of this article.)

