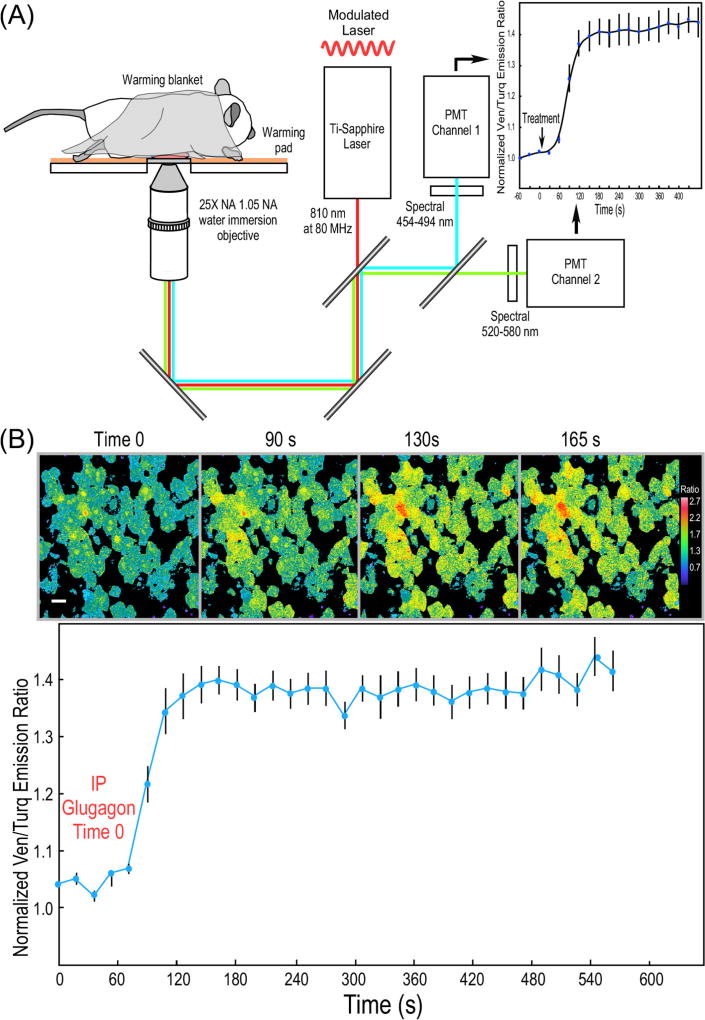
Fig. 3.
IVM ratiometric measurements of PKA activity in mouse liver. (A) Schematic diagram of the IVM system used for ratiometric measurements of biosensor probes. (B) IVM measurements of the response of the AKAR4.1 probe to glucagon in hepatocytes in the intact mouse liver. The AKAR4.1 biosensor was introduced into mice by tail vein injection of an adenoviral vector encoding AKAR4.1, resulting in extensive expression in the liver 7 days later. Mice were fasted for 3 h prior to imaging by IVM and 3D image volumes (10 planes spanning 10 mm) were collected over time prior to and following IP injection of glucagon (200 µg/kg). Ratio images from a single image plane in mouse liver were acquired at the indicated time points (scale bar is 10 µm and the look-up table indicates higher FRET ratio with warmer color). Each volume was then summed and background-corrected Ven/Turq ratios were determined for regions of interest from cells in the field. The results for AKAR4.1 are from the 10 individual cells (±SE). [from Ref. [12]]. (For interpretation of the references to color in this figure legend, the reader is referred to the web version of this article.)

