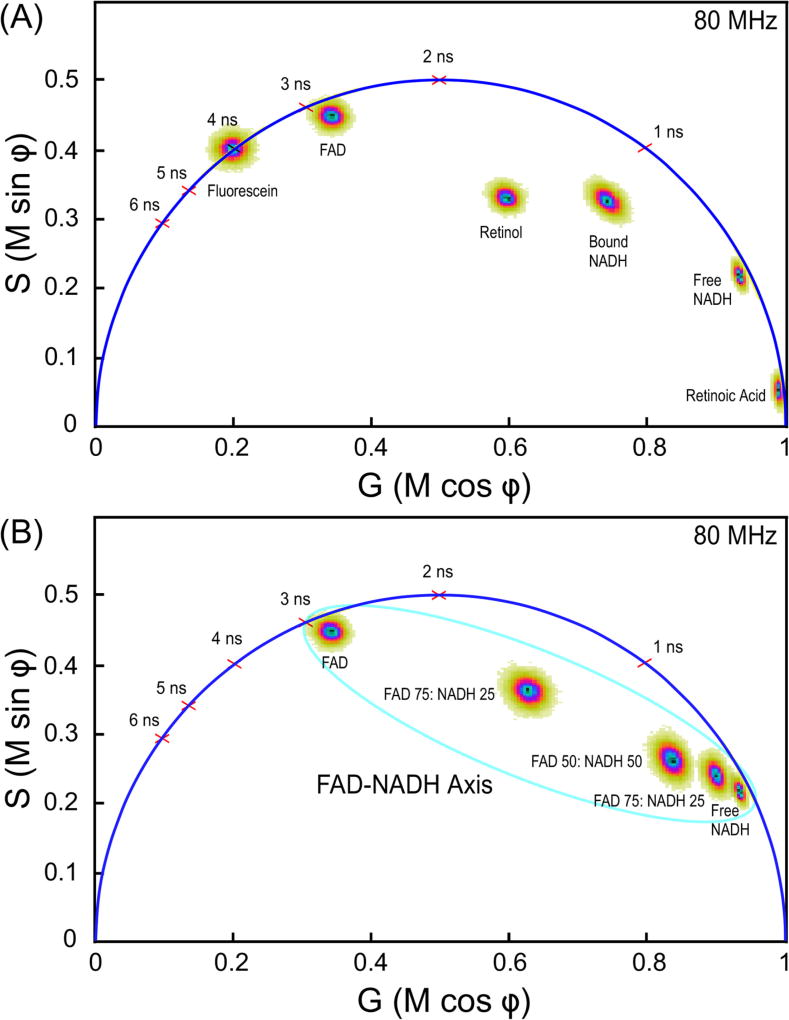
Fig. 4.
FLIM measurements of different cellular fluorophore lifetimes. (A) The phasor plot analysis of the five different solutions of standard intrinsic auto-fluorescent species (Section 3.5). Fluorescein dissolved in 1 mM NaOH (4 ns lifetime) is used to calibrate the FLIM system before each experiment. The lifetime distribution for fluorophores with single-component decays, such as fluorescein, fall directly on a universal semicircle, whereas the lifetime distributions for fluorophores with multi-component decays fall inside the semicircle. (B) The phasor plot of the lifetime distributions for FAD, NADH, or the indicated different molar ratio mixtures of the two. The phasor plot illustrates the FAD-NADH axis where the lifetime distributions for the principle cellular auto-fluorescence species occurs.

