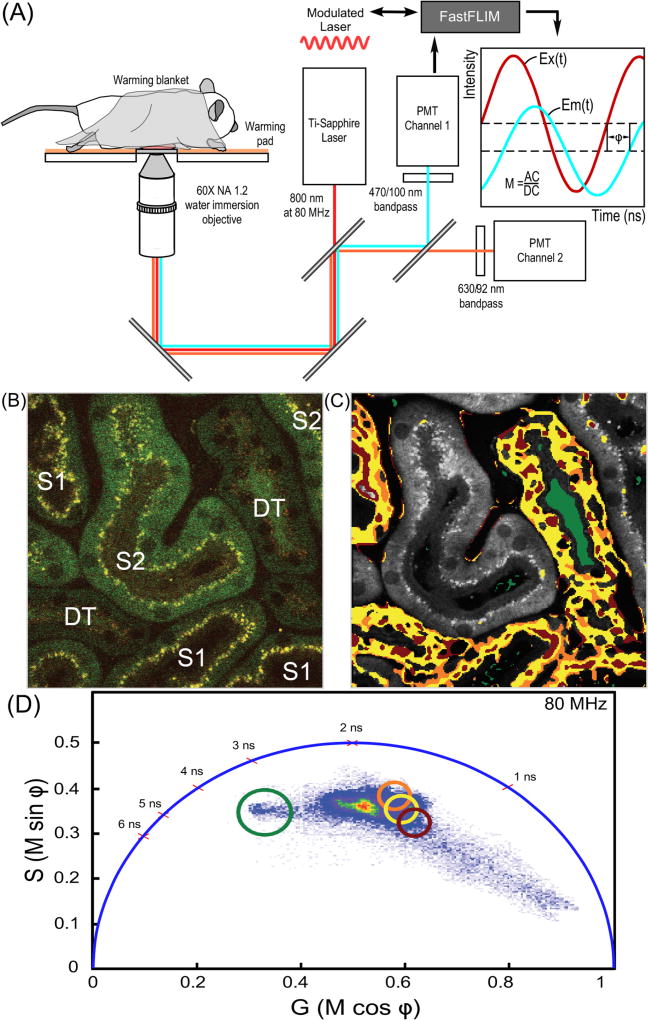
Fig. 5.
IVM FLIM measurements in living animals. (A) Schematic diagram of the IVM system for FLIM measurements of intrinsic auto-fluorescence in the tissues of living animals. (B) The 2PE IVM intensity image collected from the mouse kidney showing the first (S1) and second (S2) segments of proximal tubules, and distal tubules (DT). (C) The color-coded phasor image projected on the grayscale 2PE intensity image. The pixels in the color-coded phasor image are highlighted with the same color as the circles used to define the gated lifetime ROI shown in panel (D). (D) The phasor fingerprint for the region of kidney shown in panel (C) with the gated lifetime ROI (red, yellow, orange, green circles) indicated. These lifetime ROI are characteristic of the S1 tubules and DTs, and indicate that the cellular metabolic signature in these regions differs from that of the S2 segments. (For interpretation of the references to color in this figure legend, the reader is referred to the web version of this article.)

