Figure 2.
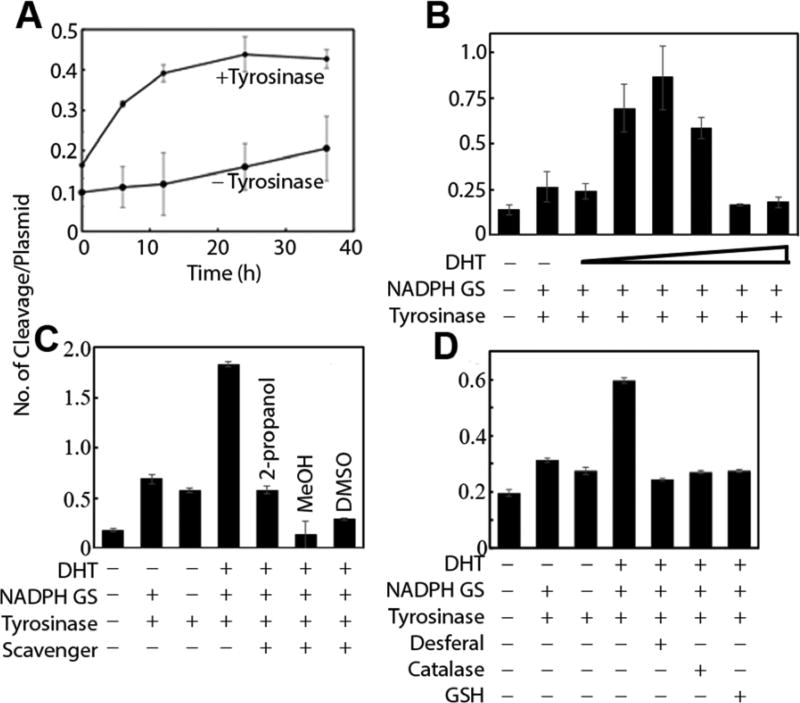
Plasmid DNA cleavage assay A) Plasmid DNA cleavage by 10 µM DHT in the presence and absence of tyrosinase. B) DNA cleavage efficiency by DHT (100 nM-10 µM) in the presence of tyrosinase and NADPH. (Experiments are done in triplicates, error bars represent ±SEM, Lane 1 vs 3 *P=0.029, Lane 1 vs 4 **P=0.002, Lane 1 vs 5 **P=0.0021, Lane 1 vs 6 ***P=0.0003, Lane 5 vs 7 **P=0.0023, Lane 5 vs 8 **P=0.0027) C) Effect of radical scavengers iPrOH (1 M), MeOH (1 M) or DMSO (1 M). (Lane 1 vs 2 ***P<0.001, Lane 1 vs 3 ***P<0.0001, Lane 1 vs 4 ***P<0.0004, Lane 1 vs 5 **P=0.0033, Lane 1 vs 7 ***P=0.0004, Lane 4 vs 5 **P=0.0015, Lane 4 vs 6 ***P<0.0006, Lane 4 vs 7 ***P=0.0004) D) Effect of catalase (250 µg/mL), desferal (1 mM), or GSH (5 mM). (Lane 1 vs 2 **P=0.0013, Lane 1 vs 3 *P=0.018, Lane 1 vs 4 ***P=0.0001, Lane 1 vs 5 *P=0.021, Lane 1 vs 6 **P=0.0052, Lane 1 vs 7 **P=0.0038, Lane 4 vs 5 ***P<0.0001, Lane 4 vs 6 ***P<0.0001, Lane 4 vs 7 ***P<0.0001).

