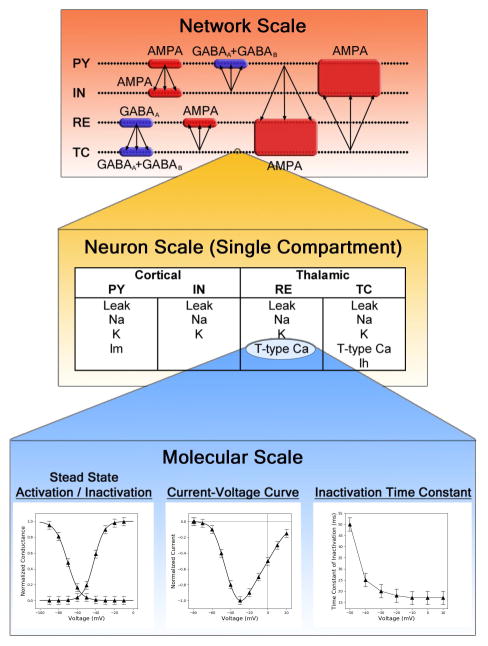
Figure 1.
Pictorial representation of the thalamocortical model. The network scale shows the arrangement of neurons (represented as dots) into pyramidal (PY) and inhibitory (IN) layers in the cortex, as well as reticular nucleus (RE) and thalamocortical (TC) layers in the thalamus; synaptic connectivity is also shown. The neuron scale lists the types of channels incorporated into each neuron type. The molecular scale depicts Hodgkin-Huxley functions used to represent each channel, which directly correspond to electrophysiology measurements. The network scale image is adapted from “Mechanisms underlying the synchronizing action of corticothalamic feedback through inhibition of thalamic relay cells.” Destexhe, A., D. Contreras, and M. Steriade, J Neurophysiol, 1998. 79(2): p. 999–1016, adapted with permission.

