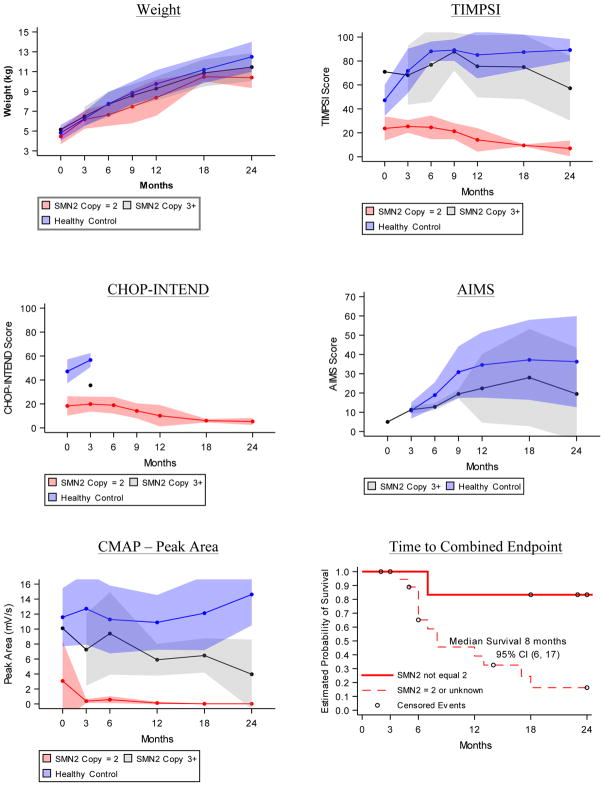
Figure 2. Progression of Outcomes.
Longitudinal average weight and motor function test results in first two years of life for healthy infants (blue), SMA infants where SMN2 copy number = 2 or is unknown (red) and SMA infants where SMN2 copy number > 2 (grey). A) Average weight in kilograms at each study visit. B) Average Test of Infant Motor Performance Screening Items (TIMPSI) score, C) The Children’s Hospital of Philadelphia Infant Test for Neuromuscular Disorders (CHOP-INTEND) score and D) Alberta Infant Motor Score (AIMS) score at each study visit. E) Average ulnar CMAP peak area (mV/s). Study visits linked to infant age (in months, +/− 2 weeks for visits 6, 12, 18 and 24 months). Shaded areas describe the standard deviation for each mean at each study visit. F) Kaplan-Meier curve of time to death or endotracheal tube placement plotted separately for the subgroup of SMA infants with SMN2 copy number equal to 3 or 4 (solid red line, n = 6) and for the subgroup of SMA infants with SMN2 copy number equal to 2 or unknown (dashed red line, n = 20). Circles represent censored events that occurred when participants left the study before observing either event in the combined endpoint.

