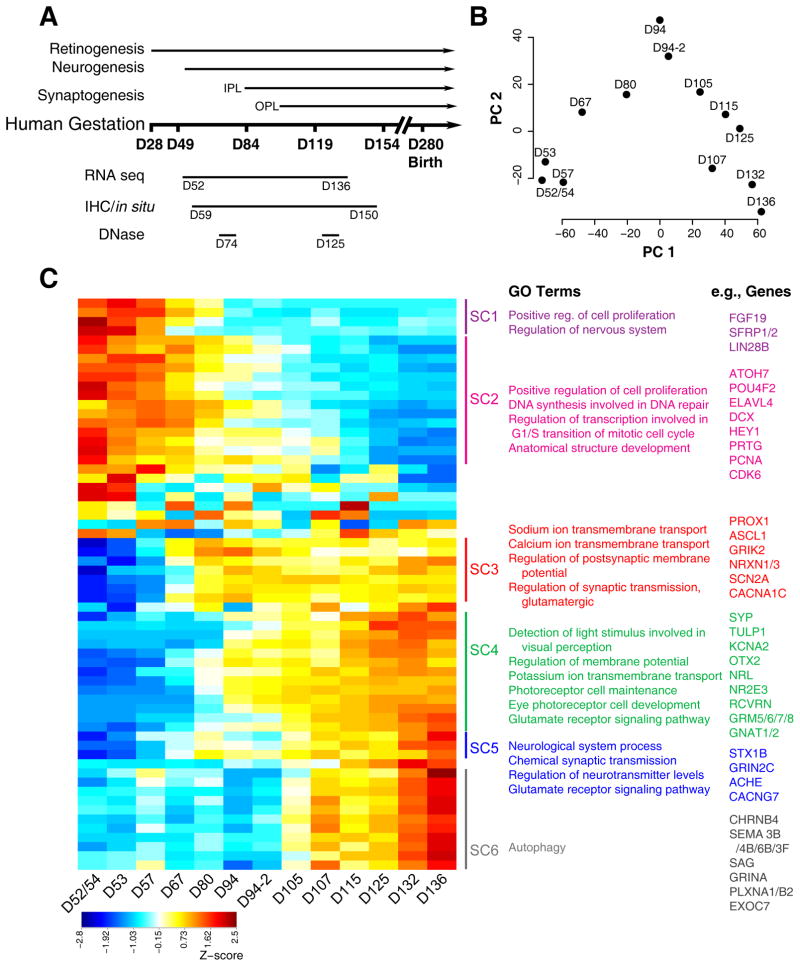
Figure 1. Global analysis of RNA-seq data of human fetal retina ages D52–D136.
A. Schematic of the experimental paradigm. The timing of developmental events was inferred using published studies of human fetal retina and birthdating studies of monkey retinae by shifting proportionately by length of gestation. Whole retinae were collected for RNA-seq (D52–D136; 17 samples) and DNase-seq (D74 and D125) studies. Whole eyes (D59–D150) were processed for immunohistochemistry and in situ hybridization. B. Principle component (PC) analysis indicated that the largest source of variation among the RNA-seq samples was age accounting for 59.3% of the variance in the data. Biological replicates for D94 were included in this study and were differentiated from each other with suffixes (e.g., D94-2). C. Z-score of the exemplar genes from the 62 clusters found by Affinity Propagation (AP) clustering analysis. Blue to red indicates a gradient from low to high gene expression. Six superclusters were obtained by cutting the dendrograms at a height 0.125 of 62 clusters. Pathway enrichment analysis was carried out for the genes in each supercluster. The top GO categories and examples of genes found in the cluster are given. See also Figures S1 and S4.

