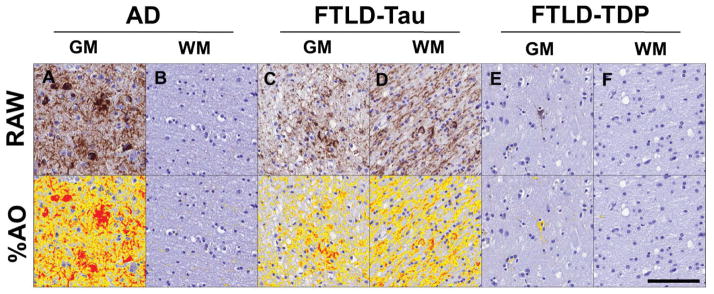
Figure 1. Digital image analysis of cerebral tau pathology.
Representative photomicrographs depict raw images (top) and digital image analysis thresholding quantification (%AO; bottom- red/orange/yellow overlay) of tau pathology in the mid-frontal cortex for A–B) AD, C–D) FTLD-Tau and E–F) FTLD-TDP with coincident AD pathology. There is higher overall and GM burden of cerebral tau pathology in AD compared to FTLD-Tau and FTLD-TDP, while FTLD-Tau has higher white-matter tau pathology compared to both groups.

