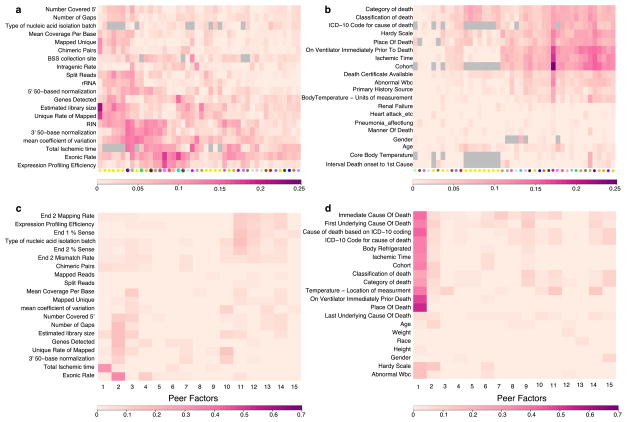
Extended Data Figure 1. Association of known covariates with expression components removed by PEER.
Each cell depicts the adjusted (R2) between a pair of variables. Scale bar specific to each panel is displayed at the bottom. Grey cells represent pairs of variables without sufficient data to estimate correlation. a, For each tissue, adjusted (R2) reflecting the proportion of variance explained by each covariate of the entire PEER component removed from the expression data. A selected set of the most relevant sample-specific covariates is shown here. b, For each tissue, adjusted (R2) reflecting the proportion of variance explained by each covariate of the entire PEER component removed from the expression data. A selected set of the most relevant donor-specific covariates is shown here. See Supplementary Information for complete set of covariates. c, Adjusted R2 between each PEER factor and known sample covariates in skeletal muscle. d, Adjusted R2 between each PEER factor and known donor covariates in skeletal muscle.

