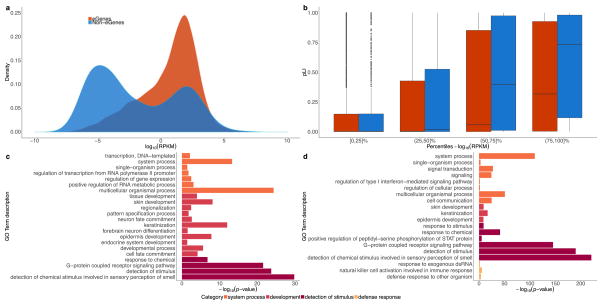
Extended Data Figure 3. Properties of cis-eGenes and non-eGenes.
In these analyses, ‘non-eGenes’ refers to the set of genes with no significantly associated cis-eQTLs. a, Density of expression (mean across samples, median across tissues, in log10 scale) for cis-eGenes and non-eGenes. The difference in mean expression for cis-eGenes and non-eGenes is significant (Wald test; P <1 ×10⁻¹⁶). b, Box plots comparing the probability of being loss-of-function-intolerant (pLI) scores41 for cis-eGenes and non-eGenes, stratified by expression percentile across all genes (mean across samples, median across tissues, in log10 scale). On average, highly expressed non-eGenes have higher pLI scores than highly expressed cis-eGenes (t-test for the difference in mean pLI score between cis-eGenes and non-eGenes; BH adjusted P = 8.3 ×10⁻⁴ and 2.1 ×10⁻⁹ for (50,75]% and (75,100]%, respectively) and lowly expressed non-eGenes (t-test for the difference in mean pLI score between highly and lowly expressed non-eGenes; BH adjusted P ≤7.8 ×10−46, P ≤5.5 ×10⁻¹⁷ and P ≤2.1 ×10⁻³ for (75,100]% vs [0,25]%, (75,100 vs (25,50]% and (75,100]% vs (50,75]%, respectively). c, Gene Ontology (GO) analysis of tested protein-coding non-eGenes. We used the PANTHER overrepresentation test78 (release 20160715) against 20,972 human genes as background to test for enrichment in GO biological processes using the GO database release 2017-02-28. Significant GO IDs (Bonferroni adjusted P < 0.05) were selected for analysis with REVIGO79 to group similar ontological terms, which yielded 22 over-represented GO IDs. d, GO analysis of a more stringent set of protein-coding non-eGenes. Selected genes included those not tested in GTEx (532 genes) or those with a minimum nominal P value across tissues greater than 0.1 (692 genes). Of these stringent 1,224 non-eGenes, 808 were mapped in the GO analysis. Using a similar approach as in c, 20 over-represented GO IDs were identified. For both c and d, the x-axis represents the −log10 P value resulting from GO analysis. GO IDs are coloured by the broader enrichment category to which each corresponds. Box plots depict the IQR, whiskers depict 1.5× IQR.

