Fig. 3.

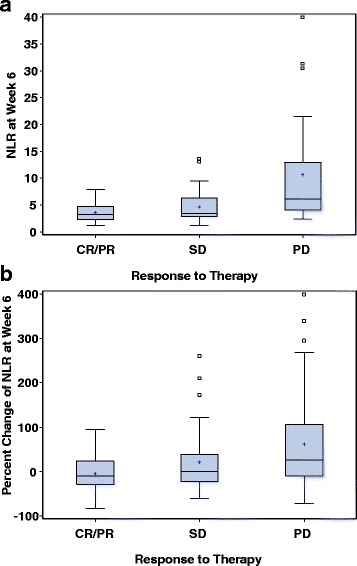
Neutrophil-to-lymphocyte ratio (NLR) at week 6 (a) and percent (%) change of NLR at week 6 (b) according to response to therapy (complete/partial response, CR/PR; stable disease, SD; progressive disease, PD)

Neutrophil-to-lymphocyte ratio (NLR) at week 6 (a) and percent (%) change of NLR at week 6 (b) according to response to therapy (complete/partial response, CR/PR; stable disease, SD; progressive disease, PD)