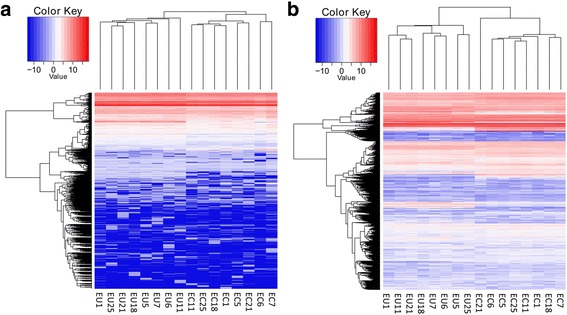
Fig. 1.

Heat map showing differentially expressed miRNAs and mRNAs from ectopic endometria compared with paired eutopic endometria. Rows represent miRNAs (a) or mRNAs (b); columns represent profiled samples. The relative expression is depicted according to the color scale. Red indicates up-regulation; blue indicates down-regulation. EU means eutopic endometrium and EC means ectopic endometrium
