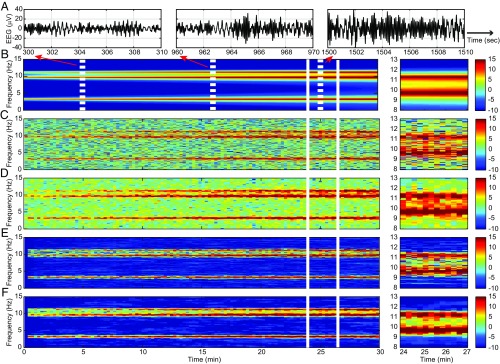
Fig. 1.
Spectrogram analysis of the time-varying sixth-order autoregressive process defined in Eq. 18. (A) Ten-second segments from the simulated time series starting at 5, 16, and 25 min. (B) True spectrogram. (C) Periodogram. (D) MT spectrogram. (E) SS periodogram. (F) SS-MT spectrogram. Right shows for each panel a zoomed-in display of the 3 min between 24 and 27 min. The color scale is in decibels.

