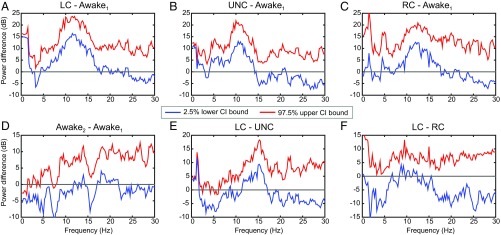
Fig. 4.
The 95% CIs for comparisons of the average power differences between the anesthetic states in Fig. 3A. Each panel shows the 95% empirical Bayes confidence interval (CI) for the average power difference defined by the lower 2.5% CI bound (blue curves), and the upper 97.5% CI bound (red curves). (A) LC-awake1: LC compared with baseline conscious state. (B) UNC-awake1: UNC compared with baseline conscious state. (C) RC-awake1: RC compared with baseline conscious state. (D) Awake2-awake1: final conscious state compared with baseline conscious state. (E) LC-UNC: LC compared with the UNC state. (F) LC-RC: LC compared with RC.

