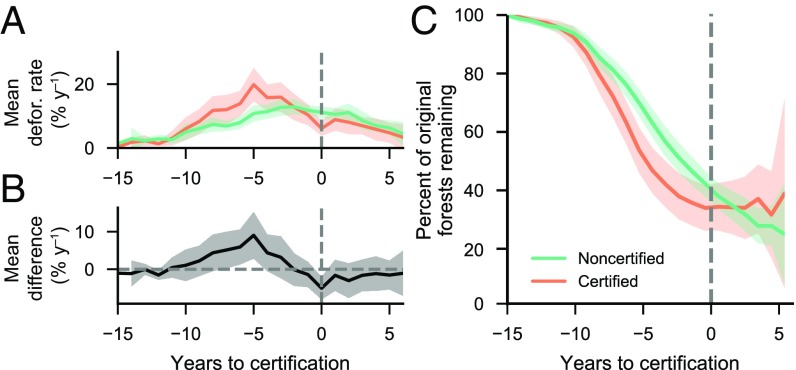
Fig. 4.
Temporal trends in deforestation (defor.) and remaining forest in RSPO-certified and noncertified oil palm plantations in Indonesia matched through 2003. The deforestation rate (A), mean difference in deforestation rate between RSPO-certified and noncertified matched samples (B), and percentage of remaining forests relative to year 2000 (C) were derived from samples matched through 2003. Noncertified statistics were calculated using synthetic control plantations. The vertical dashed line represents certification initiation, and shading indicates 95% confidence intervals.

