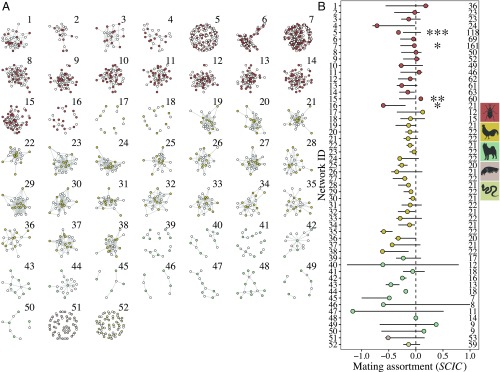
Fig. 1.
Mating assortment (SCIC) varies considerably across empirical populations. (A) Visualizations of the 52 empirical sexual networks obtained from the literature. Nodes represent males and females and the links connect mating pairs. White nodes represent females, and colored nodes represent males. Colors designate the taxonomic group of the species of each sexual network (red, arthropods; yellow, birds; green, mammals; pink, molluscs; tan, reptiles). (B) Points show the observed values of sperm competition intensity correlation (SCIC) for 52 empirical sexual networks obtained from the literature. Colors designate the taxonomic group of the species of each sexual network (red, arthropods; yellow, birds; green, mammals; pink, molluscs; tan, reptiles). Estimates are ordered Top to Bottom by taxonomic group. Error bars represent the 95% range of SCIC values based on 1,000 randomizations of each empirical network. SCIC estimates significantly different from simulated null distributions are highlighted with asterisks (***P < 0.001, **P < 0.01, *P < 0.05). The estimate of network ID 5 remained significant after correcting for false-discovery rate using the Benjamini–Hochberg procedure. Numbers on Right of the plot represent total group size (n males + n females). Estimates were obtained from the following studies [sexual network number (reference)]: 1 (17), 2–4 (84), 5 (45), 6–7 (46), 8–15 (85), 16 (86), 17–18 (87), 19–38 (32), 39–40 (88), 41 (89), 42 (90), 43 (91), 44 (92), 45–47 (93), 48 (94), 49–50 (95), 51 (96), and 52 (97).

