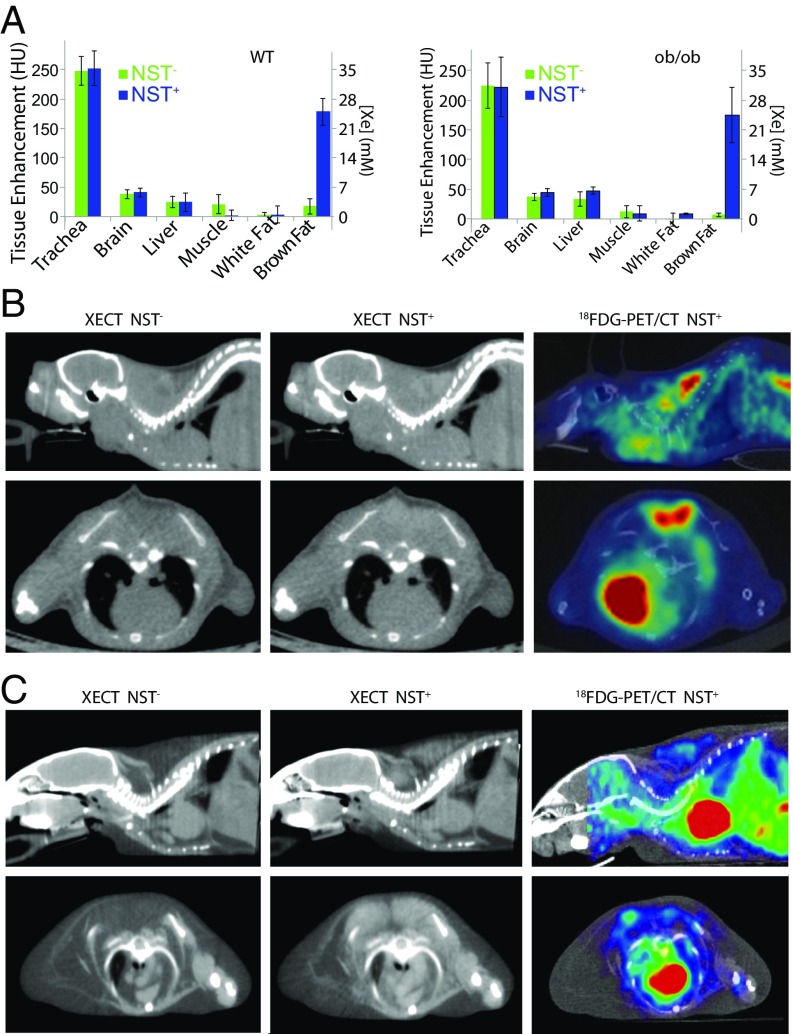
Fig. 1.
Xenon radiodensity enhancement during stimulation of NST enables BAT detection in lean and obese mouse phenotypes. (A) Enhancement in Hounsfield units (HU) and calculated xenon concentration in millimolar, as measured for six different tissues before (NST−; green) and during (NST+; blue) stimulation of NST in lean and obese mice. Error bars represent SD for n = 12 mice. (B) Representative sagittal (Upper) and axial (Lower) XECT and 18F-FDG-PET/CT images acquired in a lean mouse before (NST−) and during (NST+) stimulation of NST. (C) Representative sagittal (Upper) and axial (Lower) XECT and 18F-FDG-PET/CT images acquired in an obese mouse before (NST−) and during (NST+) stimulation of NST. Images shown are representative of XECT images collected in n = 12 lean and n = 12 obese animals and of 18F-FDG-PET/CT images collected in n = 6 lean and n = 6 obese mice.

