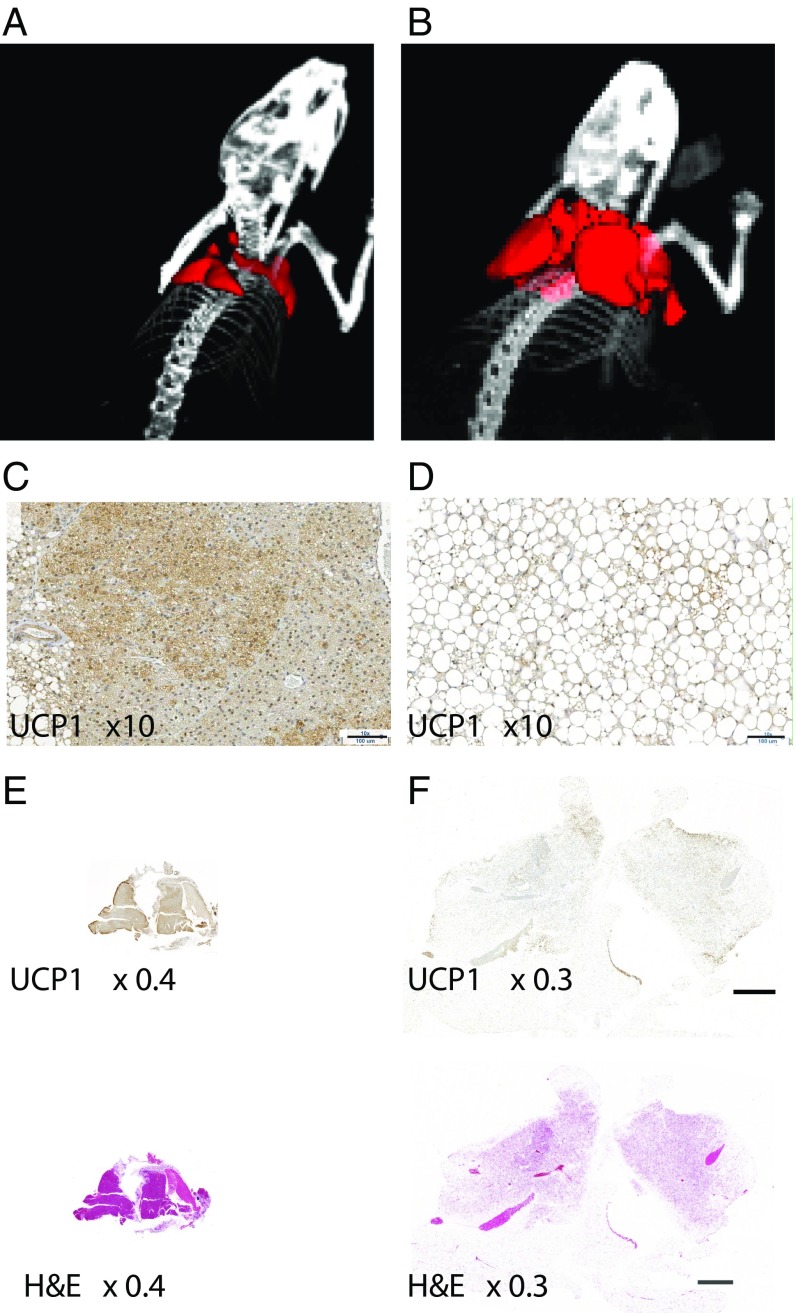
Fig. 2.
The 3D volumetric rendering of BAT by XECT and histology reveal extensive BAT hypertrophy in the obese mouse phenotype. (A) Representative 3D volumetric map of interscapular and cervical BAT as detected by XECT in lean mice. Several depots are visible: deep cervical portion, superficial cervical, interscapular, subscapular, and axillo-thoracic, as reported by Vitali et al. (39) and Frontini and Cinti (40). Image shown is representative of 3D volumetric maps collected in n = 12 lean mice. (B) Representative 3D volumetric rendering of interscapular and cervical BAT as detected by XECT in an ob/ob mouse. Image shown is representative of 3D volumetric maps collected in n = 12 obese mice. (C) High-magnification (10×) image of 5-μm UCP1-stained section of interscapular BAT from the same lean mouse. (Scale bar: 100 μm.) (D) High-magnification (10×) image of 5-μm UCP1-stained section of interscapular BAT from the same obese mouse. (Scale bar: 100 μm.) (E) Low-magnification (4×) images of 5-μm UCP1-stained section and hematoxylin–eosin-stained section of interscapular BAT from the same lean mouse. (F) Low-magnification (0.3×) image of 5-μm hematoxylin–eosin- and UCP1-stained section of interscapular BAT from the same obese mouse. Histological sections shown here are representative of interscapular BAT sections as collected from n = 6 lean mice and n = 6 obese mice.

