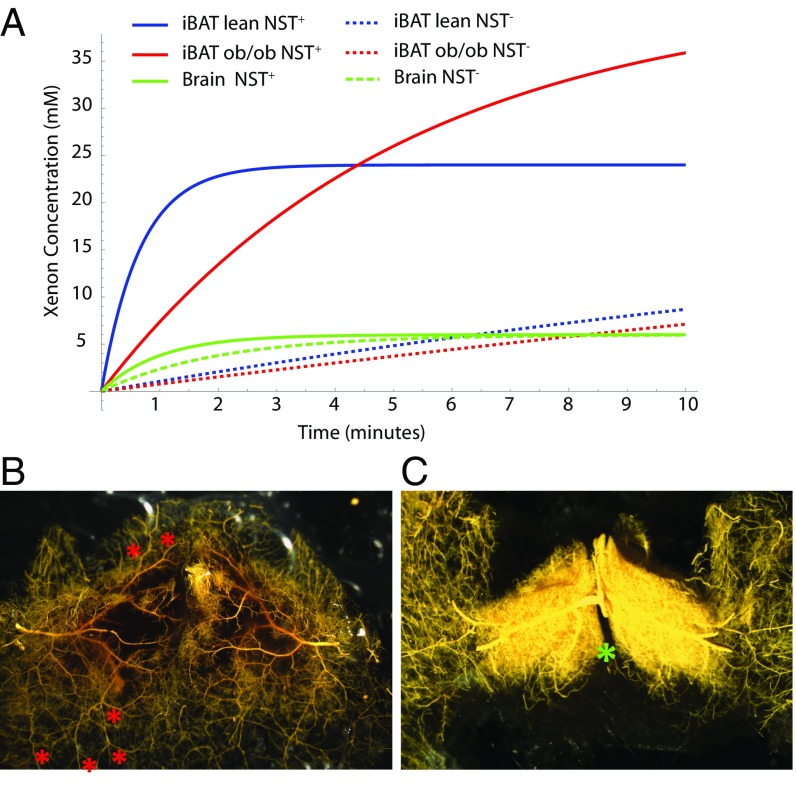
Fig. 3.
BAT microangiography reveals norepinephrine-induced changes in vasculature resistance during NST. (A) Modeling of xenon concentration in BAT and brain before and during stimulation of NST. (B) High-magnification (10×) of the vasculature of interscapular BAT (poorly filled region) and surrounding WAT (well-perfused region) of a control mouse perfused with the vasodilator nitroprusside and filled with yellow Microfil. At baseline, resistance to blood flow in BAT is increased with respect to surrounding WAT such that BAT is less perfused than surrounding WAT. Arterial–arterial anastomoses (collaterals; red asterisks) can be seen, which provide a low-resistance connection between BAT arteries and WAT artery trees/territories, shunting blood to WAT. (C) High-magnification (10×) of the vasculature of interscapular BAT of a mouse treated with norepinephrine before filling with yellow Microfil. During adrenergic stimulation of NST with norepinephrine, blood flow through BAT is increased dramatically. The increase can be ascribed to local vasoactive actions of norepinephrine that, by reducing vascular resistance in BAT and increasing the resistance of the collaterals, shunts blood from WAT to BAT. As a result, in response to sympathetic stimulation during cold exposure, simulated by norepinephrine treatment, resistance to blood flow in surrounding WAT increases, and blood flow is shunted to BAT. The differential response to sympathetic stimulation in BAT vs. WAT suggests that the BAT vascular bed is unique in its adrenergic signaling for control of the resistance of its vessels and collaterals. Images shown are representative of n = 5 control and n = 6 norepinephrine-treated mice. The location of the Sultzer’s vein is indicated by a green asterisk.

