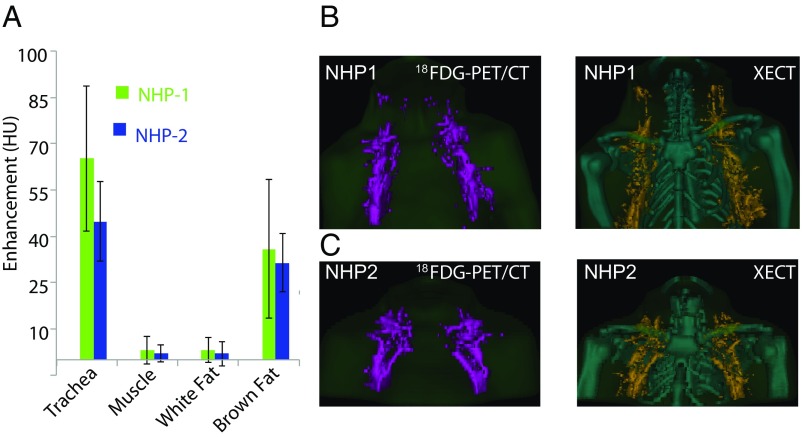
Fig. 4.
Xenon radiodensity enhancement during stimulation of NST enables 3D BAT volume quantification in NHPs. (A) Average radiodensity enhancement measured from selected regions of interest, before and during stimulation of NST, as measured in NHPs (n = 2). Error bars represent SD. (B) The 3D volumetric map of BAT as obtained by combined 18F-FDG-PET/CT and XECT in one of the NHPs (NHP1). (C) The 3D volumetric map of BAT as obtained by combined 18F-FDG-PET/CT and by XECT in the other NHP (NHP2).

