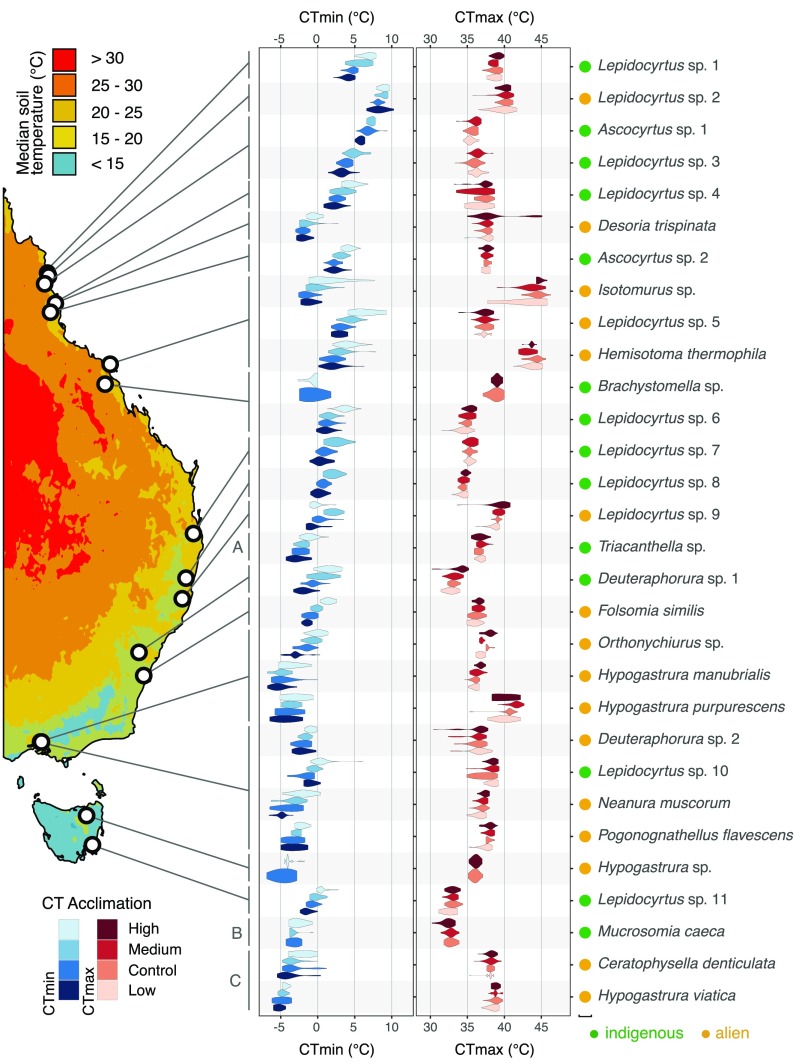
Fig. 1.
Geographic variation in basal critical thermal limits and their phenotypic plasticity across Australia. Violin plots display the frequency density of individual critical thermal limits data (smoothed with a Gaussian kernel) for control and acclimation populations of each species. In each case the control value is the basal tolerance of the species, whereas the other values refer to experimental acclimations (low, medium, high; 5 °C below, 5 °C above, 10 °C above control values, respectively) (SI Appendix, Table S8). Soil temperature contours represent the median daytime temperature 2.5-cm below the soil surface, estimated using methods detailed in SI Appendix. Lord Howe Island (A: 31.5°S, 159.0°E) and the sub-Antarctic sites of South Georgia (B: 54.2°S, 36.6°W, south of the Antarctic Polar Front) and Macquarie Island (C: 54.5°S, 158.9°E) are not shown. Indigenous and alien species are indicated by green circles and orange circles, respectively, adjacent to species names.

