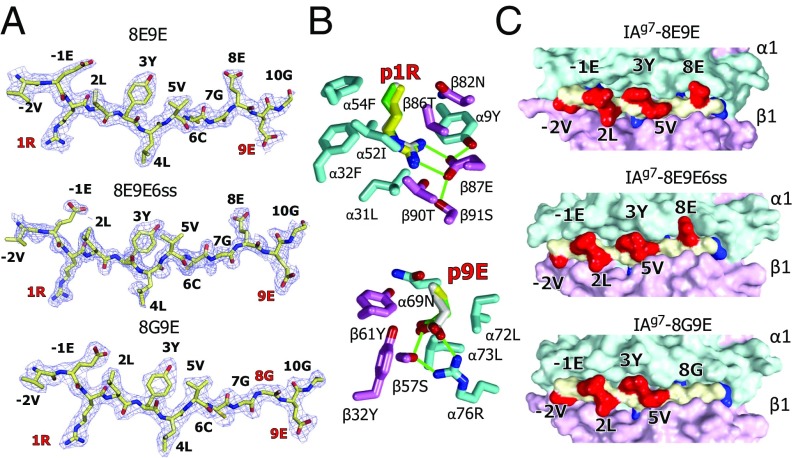
Fig. 4.
Crystal structures show very similar R3 binding of the mutated peptides to IAg7. (A) 2Fo−Fc electron density maps contoured at 1 σ within 1.5 Å of the 8E9E, 8E9E6ss, and 8G9E peptides bound to IAg7 are shown with the amino acid at each position in the MHCII binding groove labeled. The mutated amino acids are labeled in red. (B) Wireframe representations of the p1 pocket (Above) and p9 pocket (Below) of IAg7–8E9E are shown with oxygen, red and nitrogen, blue. Carbons are colored as follows: peptide, white; α chain, cyan; β chain, magenta. The side chains of p1R and p9E from the other two structures are shown superimposed, 8E9E6ss (carbons, yellow) and 8G9E (carbons, green). H bonds and salt bridges are shown with green lines. (C) Water-accessible surfaces of the IAg7 complexes are shown (α chain, cyan; β chain, magenta; peptide backbone, yellow; peptide exposed side chains, red; peptide buried side chains, blue). Exposed amino acids p-2, p-1, p2, p3, p5, and p8 are labeled.

