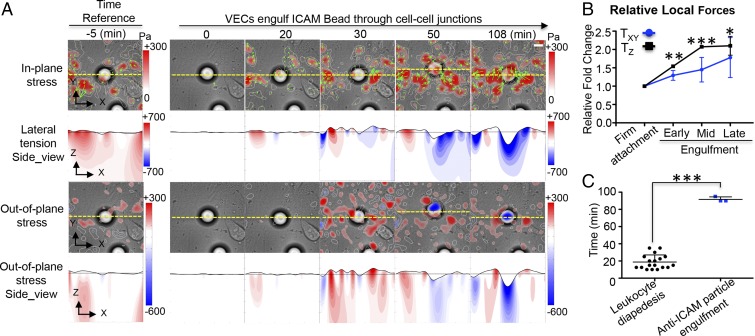
Fig. 3.
Spatiotemporal evolution of 3D stresses during the engulfment of an anti-ICAM-coated microsphere by an endothelial monolayer. (A) Live imaging of a 20-μm anti-ICAM-coated inert microsphere firmly attached to and engulfed by VECs at indicated time points. Maps showing representative spatial distributions of in-plane stress, out-of-plane stress, and local endothelial tension as describe in Fig. 2A. (Scale bar, 10 μm.) (B) Quantification of the relative changes of the local 3D stresses during the process of endothelial engulfment of anti-ICAM-coated microspheres into the endothelium. (C) The time taken for leukocyte diapedesis and for endothelial engulfment of the inert microspheres. The data are plotted as mean ± SEM of local absolute stress values normalized with the corresponding values measured at the stage of firm attachment. *P < 0.05; **P < 0.01; ***P < 0.001. The data are representative of at least three independent experiments in each case.

