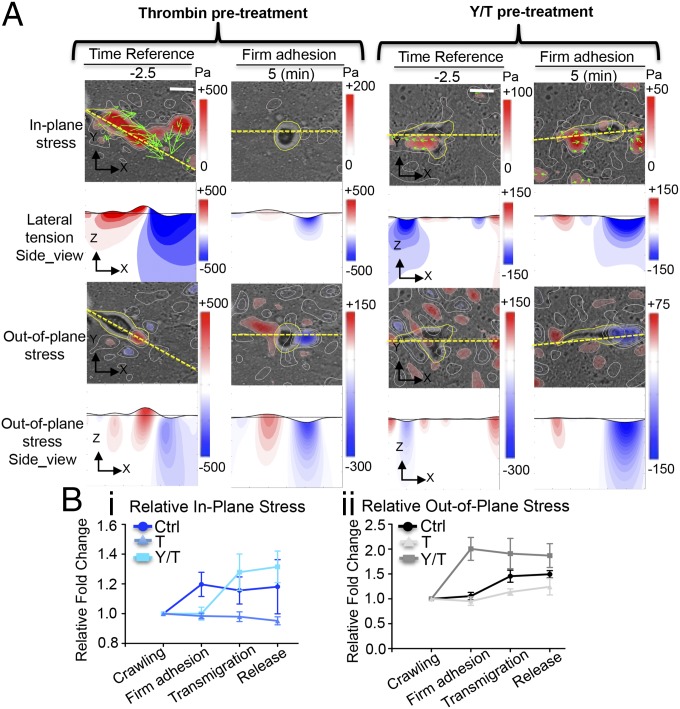
Fig. 5.
Spatiotemporal evolution of the 3D stresses during diapedesis across thrombin-treated VEC monolayers, and across monolayers treated with thrombin plus Rho kinase inhibitor. Live-cell images and stress maps of a leukocyte crawling and firmly adhered on VEC monolayers pretreated with thrombin and thrombin+Y-27632 (A). (Scale bar, 10 μm.) (B) Quantification of the relative changes of local 3D stresses in the process diapedesis of the control, thrombin, and Y/T groups. The data are plotted as mean ± SEM of local absolute stress values normalized to the crawling stage. Each data point is representative of at least five independent experiments.

