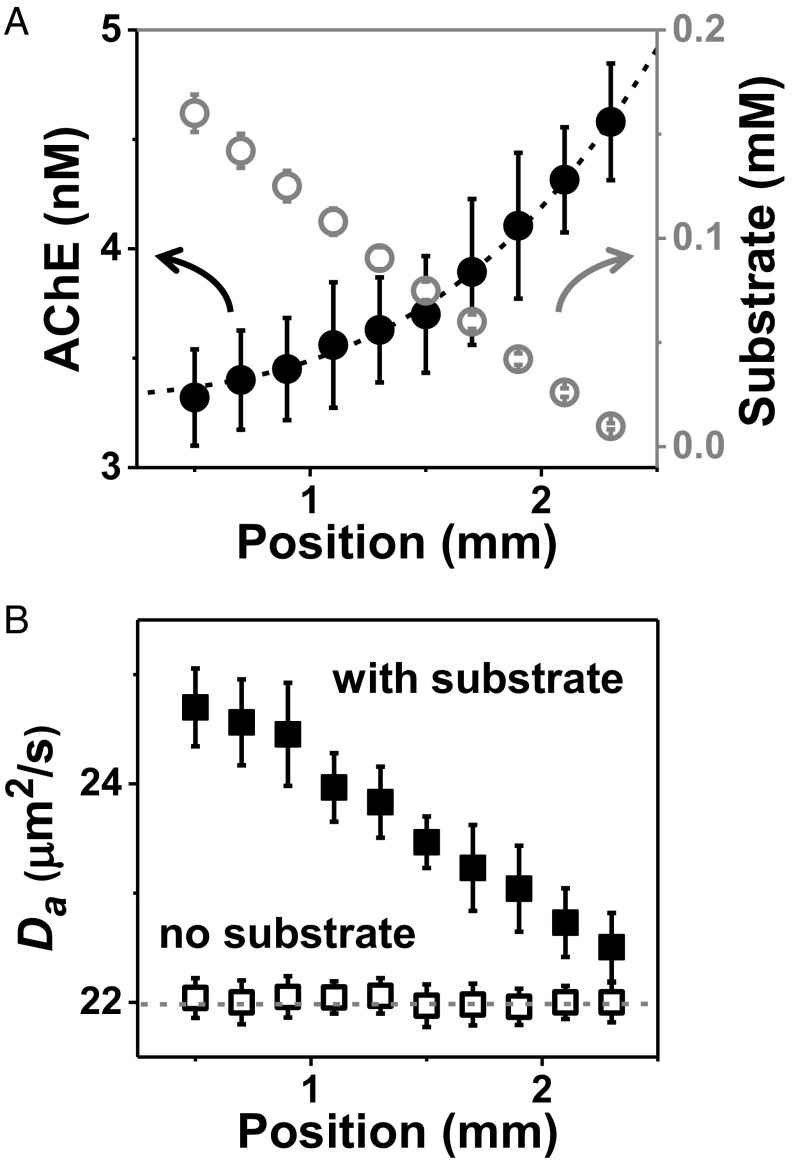
Fig. 2.
Antichemotaxis of acetylcholinesterase (AChE) when it catalyzes acetylcholine hydrolysis in a microfluidic channel. (A) Substrate concentration (open circles) and enzyme concentration (solid circles) are plotted against horizontal position with error bars showing SD of five repeated measurements. (B) The enzyme diffusion coefficient (Da) extracted from FCS autocorrelation fitting with a diffraction-limited spot size, plotted against position in the channel, in the presence (solid squares) and absence (open squares) of substrate.

