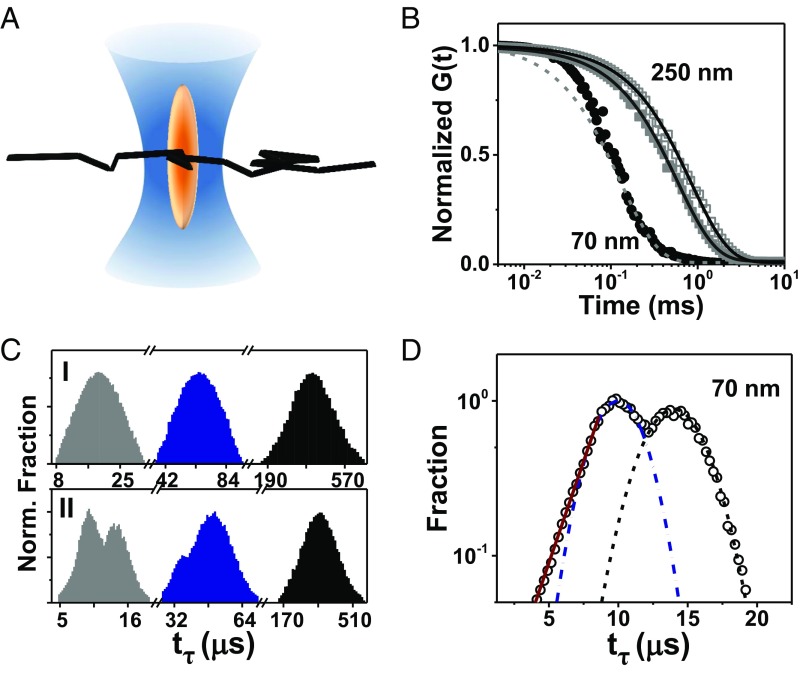
Fig. 3.
STED-FCS measurements. (A) Experimental geometry in which STED narrows the hourglass-shaped confocal spot to be elliptical. (B) Normalized autocorrelation function G(t) plotted against logarithmic time lag with w = 70 nm (circles) and 250 nm (squares), with solid and open symbols showing substrate and substrate-free, respectively. Dotted line illustrates poor fit to Fickian diffusion. (C) Transit time distribution tτ without (C, I) and with (C, II) substrate, w = 70 nm, 100 nm, and 250 nm from left to right. Bin size, 0.5 ms. (D) Log-linear plot of transit time distribution, w = 70 nm, deconvoluted into fast and slow components with Gaussian fits near the peak shown by dotted lines.

