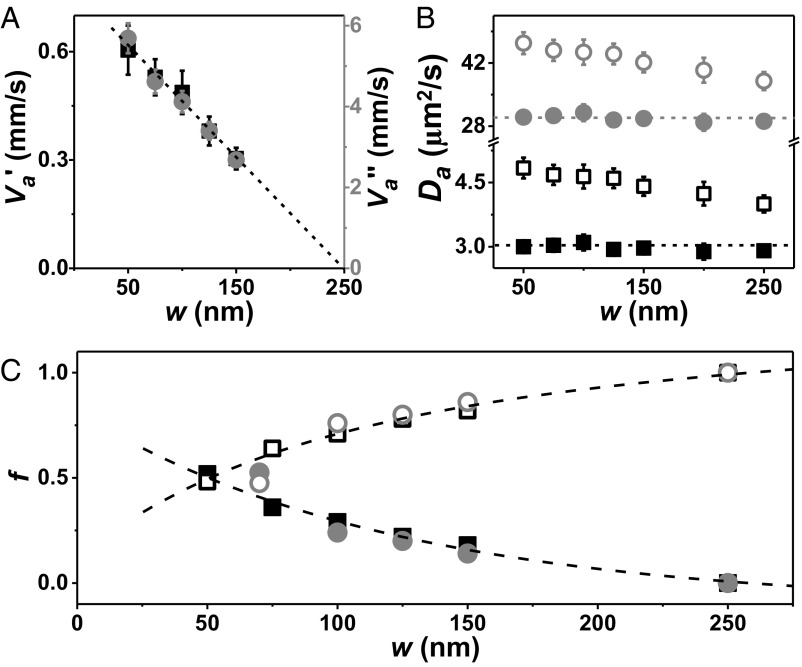
Fig. 4.
Transit time distribution. (A) Ratio of beam waist to peak time of the fast component, plotted against w in buffer with 20% Ficoll as crowding agent (black, va′) and in buffer (gray, va′′). (B) Ratio of w2 to peak time of the slow component (when w ≤ 150 nm) or peak unimodal time (larger w) plotted against w without (solid symbols) and with (open symbols) substrate in buffer (gray) and buffer–Ficoll solution (black). (C) Ratio of ballistic to diffusive (solid symbols) and diffusive to ballistic (open symbols) of transit time distribution, plotted against w in buffer with same symbols as in B. Dashed lines through the points are a guide to the eye.

