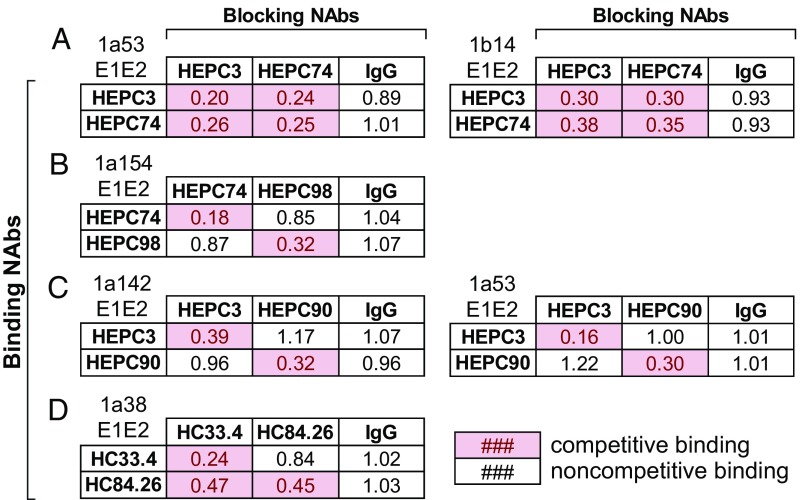
Fig. 4.
Competition binding between NAbs. Binding of 2 µg/mL of biotinylated NAbs on the y axis (“Binding NAbs”) to the indicated E1E2 proteins was measured in the presence or absence of the NAbs on the x axis (“Blocking NAbs”) at a concentration of 20 µg/mL (HEPC3, HEPC74, HEPC98, HEPC90/1a53 E1E2) or 50 µg/mL (HC84.26, HEPC90/1a142 E1E2). Values shown are binding of the biotinylated NAb in the presence of blocking NAb, relative to binding in the absence of blocking NAb, averaged from duplicate measurements. Pink boxes indicate competition, which was defined as a relative binding value of <0.50. Competition between HEPC3 and HEPC74 (A), HEPC74 and HEPC98 (B), HEPC3 and HEPC90 (C), and HC33.4 and HC84.26 (D).

