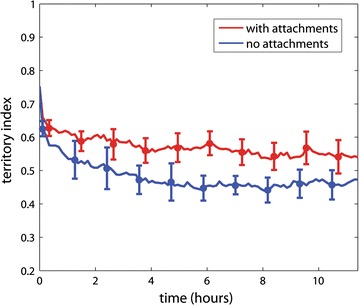
Fig. 3.

Effect of Chr–NE attachments on chromosome territories. Error bars represent 1 standard deviation calculated from n = 8 simulation trajectories. Red line—mean with attachments; blue line—mean without attachments. Biologically speaking, the territory index (y-axis) represents the fraction of chromatin inside its native convex hull (see “Methods” section)
