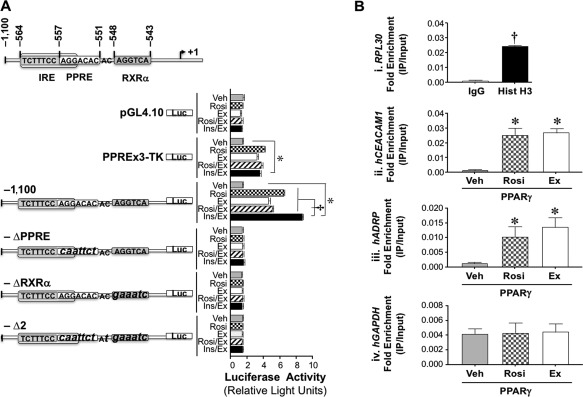
Figure 2.

Regulation of Ceacam1 expression in HepG2 cells. (A) Wild‐type (−1,100) and block mutants (small letters) of the active PPRE‐RXR site (–Δ2), PPRE (–ΔPPRE), and RXRα (–ΔRXRα) in mouse Ceacam1 were subcloned into a pGL4.10 promoterless plasmid to assess luciferase activity in triplicate in response to DMSO (vehicle, light gray), rosiglitazone (checkered), exenatide (white), rosiglitazone plus exenatide plus (hatched), and insulin plus exenatide (black). PPREx3‐TK‐luc was used as positive and PGL4.10 as negative controls. Luciferase light units are expressed as mean ± SEM in relative light units; *P < 0.05 treatment versus vehicle, †P < 0.05 Ins/Ex versus other treatments. (B) HepG2 cells were transfected with pGST‐PPARγ and hRXRα and treated with DMSO (vehicle, light gray), rosiglitazone (checkered), or exenatide (white) before ChIP analysis was carried out in triplicate by immunoprecipitating with α‐PPARγ or with normal rabbit IgG (dark gray) and Hist H3 (black) as negative and positive controls, respectively. Immunorprecipitated and input samples were evaluated by qRT‐PCR analysis using primers for RPL30 (kit control) and hCEACAM1. We also analyzed hADRP and hGAPDH as positive and negative targets of PPARγ, respectively. Results are expressed as fold enrichment (IP/Input). Values are expressed as mean ± SEM; *P < 0.05 versus Veh; † P < 0.05 Hist H3 versus IgG. Abbreviations: ChIP, chromatin immunoprecipitation; Ex, exenatide; hADRP, human adipose differentiation‐related protein; hGAPDH, human glyceraldehyde‐3‐phosphate dehydrogenase; Hist H3, histone H3; IgG, immunoglobulin G; Ins/Ex, insulin plus exenatide; IP, immunprecipitated; luc, luciferase; pGST, glutathione S‐transferase plasmid; Rosi, rosiglitazone; Rosi/Ex, rosiglitazone plus exenatide; TK, thymidine kinase; Veh, vehicle.
