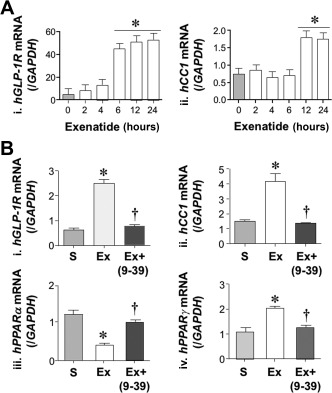
Figure 3.

Effect of exenatide on CEACAM1 and GLP‐1R mRNA levels in HepG2 cells. (A) HepG2 cells were treated with saline (light gray) or exenatide (white) for 0‐24 hours before qRT‐PCR analysis to measure (i) hGLP‐1R and (ii) hCEACAM1 (CC1) mRNA levels normalized to iGAPDH (n = 5/group in triplicate). Values are expressed as mean ± SEM; *P < 0.05 treatment group versus basal level. (B) mRNA levels of (i) hGLP‐1R, (ii) hCEACAM1 (hCC1), (iii) hPPARα, and (iv) hPPARγ were analyzed in HepG2 as above except for pre‐incubation with exendin 9‐39 (dark gray). *P < 0.05 versus S, † P < 0.05 Ex + exendin 9‐39 (Ex+ 9, 10, 11, 12, 13, 14, 15, 16, 17, 18, 19, 20, 21, 22, 23, 24, 25, 26, 27, 28, 29, 30, 31, 32, 33, 34, 35, 36, 37, 38, 39) versus Ex alone. Abbreviations: Ex, exenatide; Ex 9, 10, 11, 12, 13, 14, 15, 16, 17, 18, 19, 20, 21, 22, 23, 24, 25, 26, 27, 28, 29, 30, 31, 32, 33, 34, 35, 36, 37, 38, 39, exendin fragment 9‐39; h, human; GAPDH, glyceraldehyde‐3‐phosphate dehydrogenase; /GAPDH, normalized to GAPDH.
