
Figure 5.
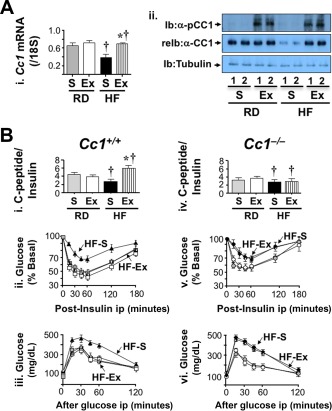
Effect of 4 weeks of exenatide treatment on insulin clearance. Mice were fed an RD or HF diet for 2 months and injected daily with exenatide in the last month. (A) (i) Cc1 +/+ liver lysates were analyzed by qRT‐PCR to measure Ceacam1 mRNA levels normalized to 18S (n = 5/each group in duplicate). Values are expressed as mean ± SE; *P < 0.05 Ex versus S/feeding group; †P < 0.05 HF versus RD/treatment group. (ii) Western blot analysis by immunoblotting with phospho‐CEACAM1 followed by re‐immunoblotting with CEACAM1 antibody. The lower part of the gel was immunoblotted with α‐tubulin for protein normalization. Gels represent more than two experiments performed on different mice per feeding per treatment group. (B) Retro‐orbital venous blood was drawn from overnight‐fasted mice to measure C‐peptide/insulin molar ratio (i and iv) in Cc1 +/+ and Cc1 –/– mice, respectively. Following a 7‐hour fasting period, mice were injected intraperitoneally with (ii and v) insulin or (iii and vi) glucose to assess insulin and glucose tolerance, respectively. Values are expressed as mean ± SEM (n = 7‐8/time point for each group); *P < 0.05 Ex versus S. Abbreviations: α‐CC1, CEACAM1 antibody; Ex, exenatide; Ib, immunoblotting; ip, intraperitoneally; pCC1, phospho‐CEACAM1; reIb, re‐immunoblotting.