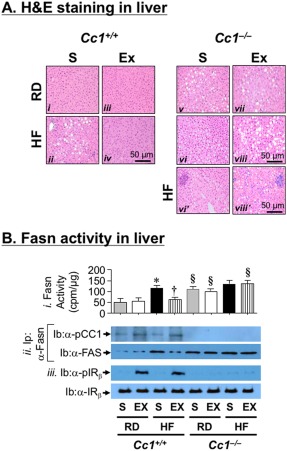
Figure 6.

Effect of 4 weeks of exenatide on hepatic lipid metabolism. (A) Liver histology was assessed in H&E‐stained sections (n = 7‐8/genotype per feeding per treatment). Representatives from (i and v) S‐treated RD‐fed, (ii, vi, and vi') S‐treated HF‐fed, (iii and vii) Ex‐treated RD‐fed, and (iv, viii, and viii') Ex‐treated HF‐fed mice are shown. Of note, vi' and viii', from the same groups as vi and viii mice, highlight the infiltration of inflammatory foci. (B) (i) Fasn activity measured in triplicate by [14C]‐malonyl‐coenzyme A incorporation (n = 5/genotype per treatment group). Values are expressed as mean ± SEM; *P < 0.05 HF‐S versus RD‐S/genotype; † P < 0.05 Ex versus S in HF‐fed Cc1 +/+, §P < 0.05 Cc1 –/– versus Cc1+/+/feeding group per treatment group. (ii) Liver lysates were immunoprecipitated with α‐Fasn followed by immunoblotting with α‐phospho‐CEACAM1 antibody. (iii) Western blot of liver lysates to assess insulin receptor phosphorylation (Ib: α‐pIRβ) and level (Ib: α‐IRβ). Abbreviations: α‐pCC1, α‐phospho‐CEACAM1 antibody; cpm, counts per minute; H&E, hematoxylin and eosin; Ib, immunoblotting; Ip, immunoprecipitation; IR, insulin receptor; pIR, insulin receptor phosphorylation.
