
Figure 3.
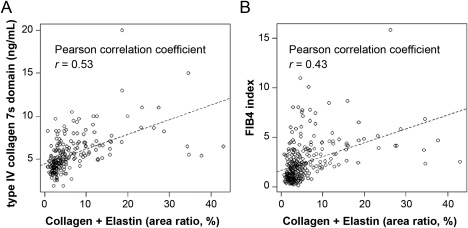
Scatterplots with regression lines showing the correlation of the combined fiber area ratios with the (A) serum concentration of 7s collagen or (B) the FIB‐4 index.
Official websites use .gov
A
.gov website belongs to an official
government organization in the United States.
Secure .gov websites use HTTPS
A lock (
) or https:// means you've safely
connected to the .gov website. Share sensitive
information only on official, secure websites.
Scatterplots with regression lines showing the correlation of the combined fiber area ratios with the (A) serum concentration of 7s collagen or (B) the FIB‐4 index.