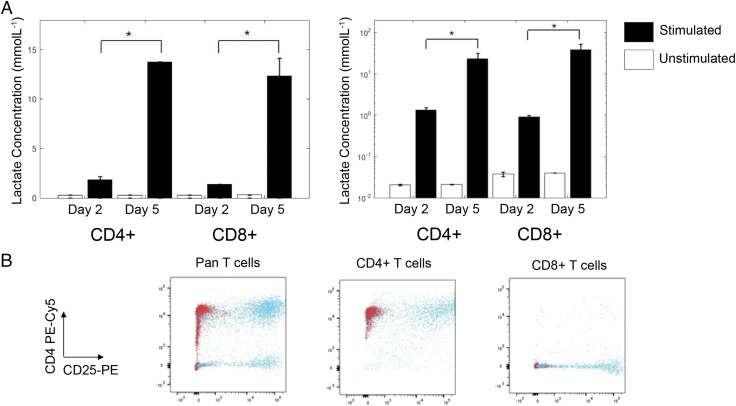
FIGURE 1.
Extracellular lactate production by human T cells. (A) CD4+ and CD8+ T cells from two donors were cultured or not for 2 and 5 d with anti-CD3/CD28 Dynabeads, and supernatants were collected in triplicate for analysis of extracellular lactate. Lactate was normalized to viable cell number at each time point. (B) On day 5, the remaining cells were analyzed by flow cytometry for purity and activation status, as shown by CD4–PE–Cy5 versus CD25-PE staining. Red dots represent unstimulated cells, and blue dots represent stimulated cells. Unstimulated cell lactate output showed no change between days 2 and 5. *p < 0.01.

