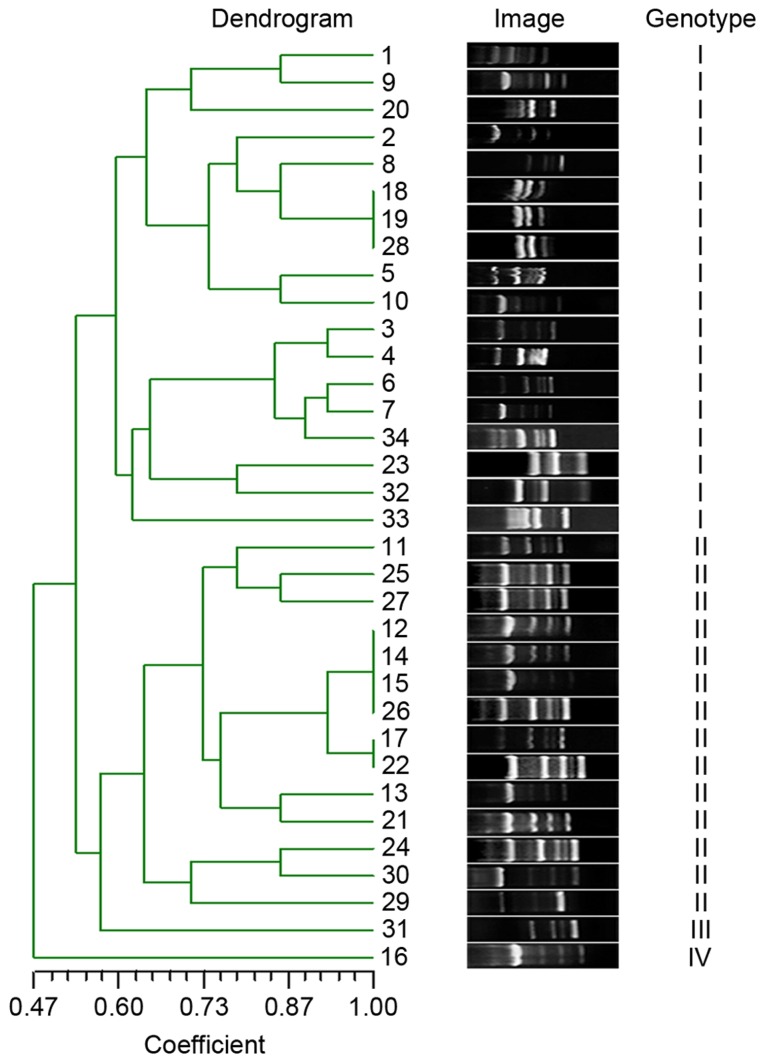
Figure 1.
RAPD fingerprinting of MDRAB strains. The gel image displayed diversity RAPD genotyping pattern of each MDRAB isolates representing various phenotypes from different wards. The genotypic similarities were calculated by NTsys 2.10e using dice similarity index and UPGMA, presented in the left of the glue image with coefficients and lines. Four genotypes (I–IV) were formed at a 60% similarity level. RAPD, randomly amplified polymorphic DNA; MDRAB, multidrug resistant Acinetobacter baumannii; UPGMA, unweighted pair group average.

