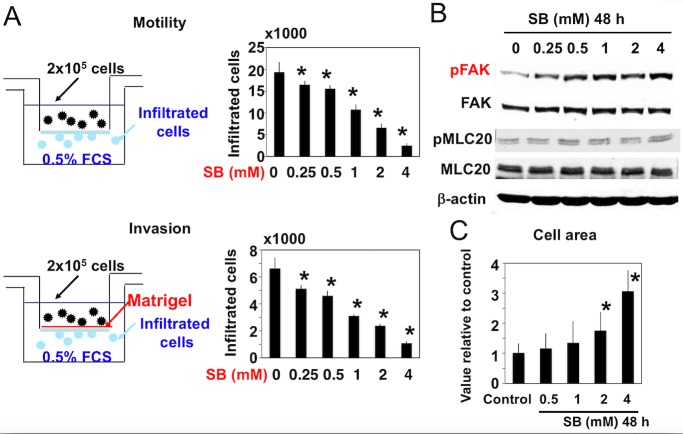
Figure 4.
Effect of SB on the motility, invasion and morphology of A172 cells. (A) Upper panel: A172 cells were treated with the indicated concentrations (0–4 mM) of SB for 48 h and then cell motility was analyzed using with 0.5% FBS as a chemoattractant. Results are presented as the mean ± standard deviation (n=6). Lower panel: Cell invasion was analyzed with 0.5% FBS as a chemoattractant using Matrigel-coated chambers. Results are presented as the mean ± standard deviation (n=3). *P<0.01 vs. control. (B) A172 cells were treated with the indicated concentrations (0–4 mM) of SB for 48 h and then the phosphorylation of FAK and MLC20 were analyzed by western blotting. (C) A172 cells were treated with the indicated concentrations (0–4 mM) of SB for 48 h and then cell spreading was analyzed by measuring the cell area. Results are presented as the mean ± standard deviation (n=100). *P<0.01 vs. control. SB, sodium butyrate; FBS, fetal bovine serum; FAK, focal adhesion kinase; MLC, myosin light chain; p-, phosphorylated.

