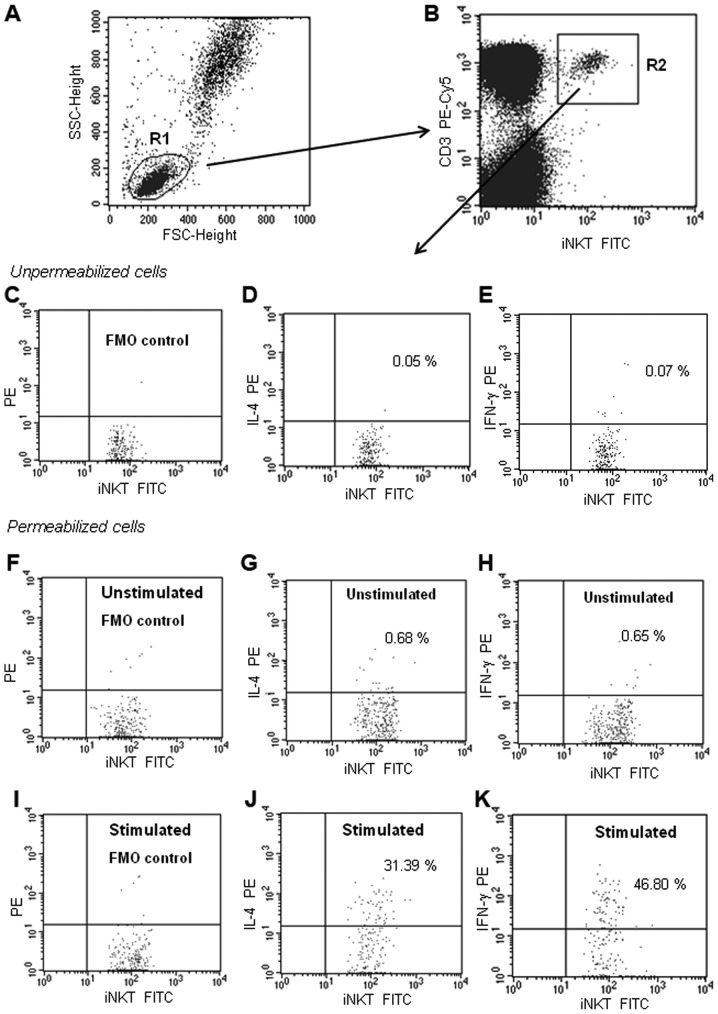
Figure 1.
Representative dot plots illustrating the analysis method for the identification of iNKT+ cells with IL-4 or IFN-γ expression. (A) An acquisition gate was established based on FSC and SSC that included mononuclear cells. The R1 region was drawn around the lymphocytes. (B) The R1 gated events were analyzed for TCR Vα24-Jα18 FITC (anti-iNKT) and CD3 PE-Cy5 staining, and the positive cells were gated (region R2). The dot plots C-K were established by the combined gating of events using R1 and R2 regions. Three dot plots (C-E) indicate no-permeabilization control (checking whether the antibody binds to the antigen only after permeabilization). Six dot plots (F-K) indicate the identification of iNKT cells with intracellular IL-4 or IFN-γ (after permeabilization). (C, F and I) Dot plots indicating the FMO control, which contains all the fluorochromes in a panel, except for the one (IL-4 PE or IFN-γ PE) that was measured. The final dot plots indicate iNKT cells (TCR Vα24-Jα18 FITC+CD3PE-Cy5+) cells positive for (D, G and J) IL-4 or (E, H and K) IFN-γ. (D and E) The number in the upper right quadrant represents the percentage of iNKT cells that bound the anti-IL-4 or anti-IFN-γ MoAbs without permeabilization (non-specific binding). (G and H) The two dot-plots represent IL-4 and IFN-γ expression in the unstimulated iNKT cells (non-activated cells from 24-h culture only with BD GolgiPlug™). (J and K) The number in the upper right quadrant represents the percentage of iNKT cells with intracellular IL-4 or IFN-γ expression (after α-GalCer stimulation). FSC, forward scatter; SCC side scatter; FMO, Fluorescence Minus One Control; CLL, chronic lymphocytic leukemia; iNKT, invariant natural killer T cells; IL, interleukin; IFN, interferon; α-GalCer, α-galactosylceramide; MoAb, monoclonal antibody.

