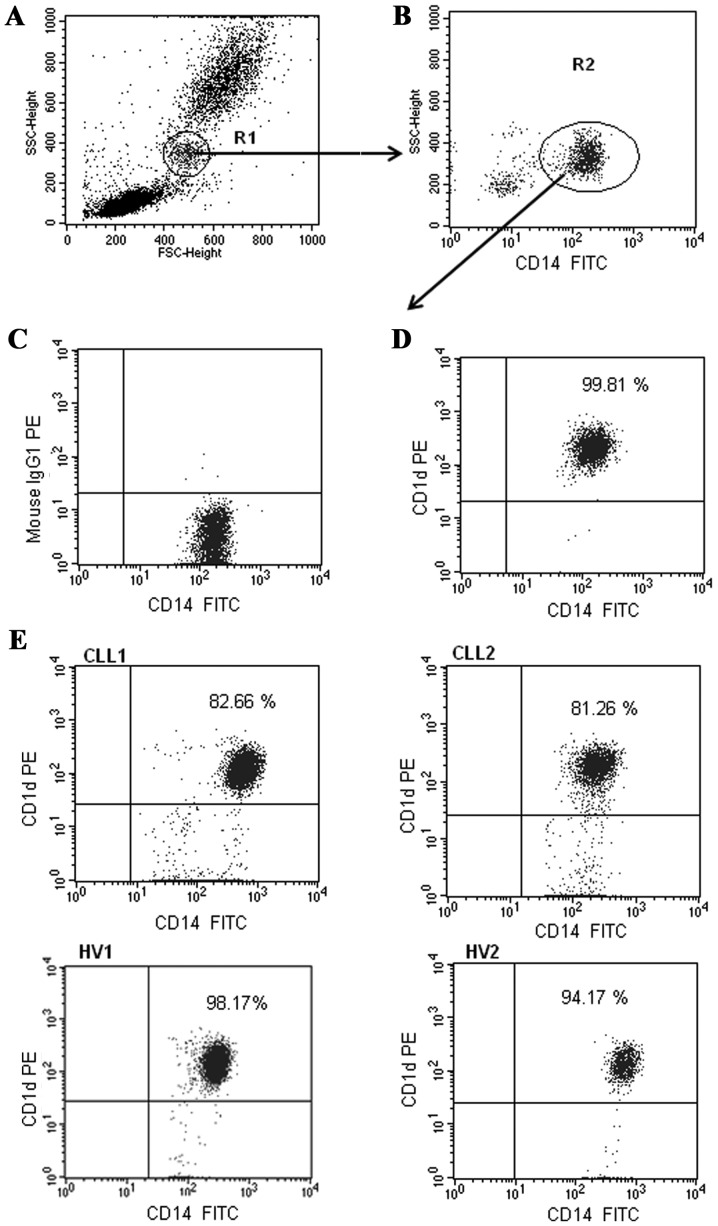
Figure 2.
Representative dot plots illustrating the method of analysis for the identification of monocytes with CD1d expression. (A) First, monocytes were gated (R1 region) based on FSC and SSC. (B) Dot plot of monocytes: CD14 FITC vs. SSC. CD14 positive cells were selected (region R2). Final dot plots (C) CD14 FITC vs. mouse IgG1 PE and (D and E) CD14 FITC vs. CD1d PE were established via the combined gating of events using R1 and R2 regions. The numbers in the upper right quadrant on the dot plots represent the percentage of monocytes with CD1d membrane expression (CD14+CD1d+). (E) The dot plots indicate two representative types of CD1d expression on the monocytes from patients with CLL (CLL1-CLL2) and two representative types of CD1d expression on the monocytes from HVs (HV1-HV2). FSC, forward scatter; SCC side scatter; HV, healthy volunteer.

