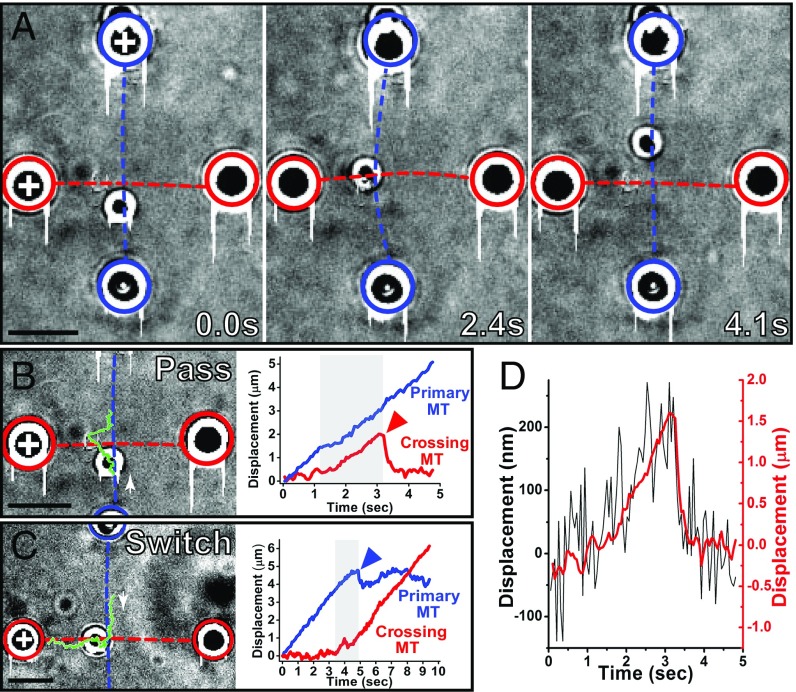
Fig. 2.
Identification and quantification of ToW. (A) Three movie frames: before (Left), during (Center), and after (Right) ToW. +, MT plus ends. Note the displacement of the top bead handle during ToW. Frame timings are shown in the lower right corner of each image. (B) Analysis of the pass event shown in A. (B, Left) Trajectory of the cargo (green) overlaid on one cropped movie frame. White arrow, the start of the track and the plus-end direction on the primary MT. (B, Right) Cargo displacements projected along the primary (blue) and crossing (red) MT directions. Red arrowhead, the snapback event which is typical of a ToW conclusion; gray band, ToW temporal extent (∼1.9 s). (C) Analysis of a switch event. (C, Left) Trajectory of the cargo (green) overlaid on one movie frame. White arrow, the start of the track and the plus-end direction on the primary MT. (C, Right) Cargo displacement projected along the primary (blue) and crossing (red) MT’s axes (0.5-μm separation). Blue arrowhead, the snapback event which is typical of a ToW conclusion; gray band, ToW temporal extent (∼1.6 s). Common highlight scheme for A–C: Blue/red dashed lines and circles, primary/crossing MT positions and bead handle positions (0.5-μm separation geometry). (D) Cargo displacement (red) along the crossing MT axis shown in B overlaid onto trace of bead handle displacement (black) from trap center, due to ToW (for the top bead handle in A). (Scale bars, 5 µm.)

