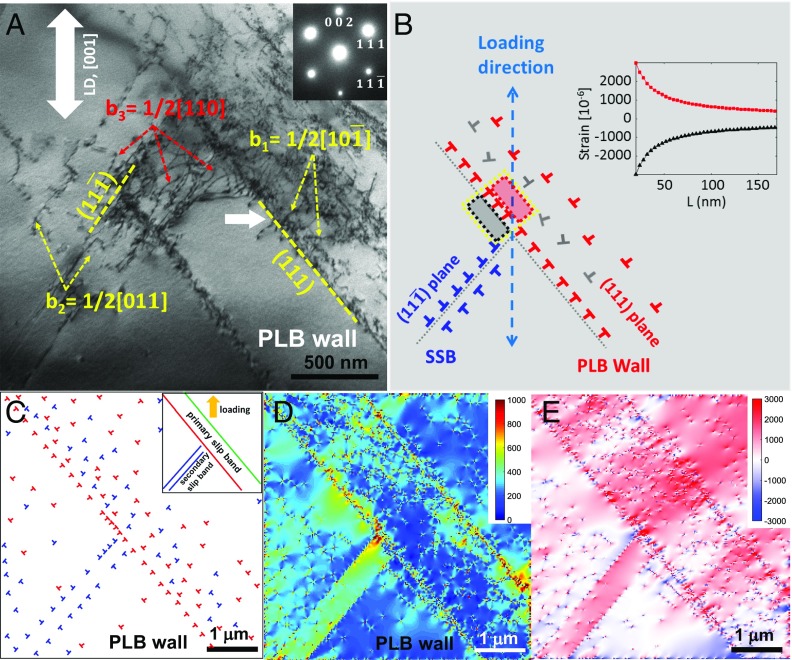
Fig. 4.
TEM image and dislocation dynamic simulations of dislocation structures in an [001] grain. (A) Bright-field TEM image viewed along the [110] zone axis (with the electron diffraction pattern displayed in the Inset), showing dislocation structures in the (111) primary slip band and the () secondary slip band (SSB). The (111) primary slip band consists of a sharp wall of a planar array of dislocations with the same sign, and hence this band is marked as a persistent Lüders band (PLB). (B) Analysis of the large local strain gradient developed the intersection of the two slip bands. Inset shows the calculated local strain gradient in the boxed region; the tensile strain at the red box and the compressive stress at the black box are calculated as a function of dislocation spacing, L, in the dislocation pileup array representing a sharp wall of a PLB. (C) Relaxed dislocation configuration from a 2D dislocation dynamics simulation of interactions between dislocations in the primary and secondary slip bands (as schematically shown in Inset). (D and E) Contour of (D) von Mises stress and (E) lattice strain along the q vector of [120], which are calculated from the relaxed dislocation configuration in C. To a first approximation, two conjugate slip systems are assumed to be activated during cyclic loading in the simulation; the dislocation configuration and associated stress/strain field were obtained through unloading and thus relaxing the applied load. The applied shear stress in the simulation cell, elastic modulus, and Poisson’s ratio are taken as 100 MPa, 190 GPa, and 0.3, respectively.

