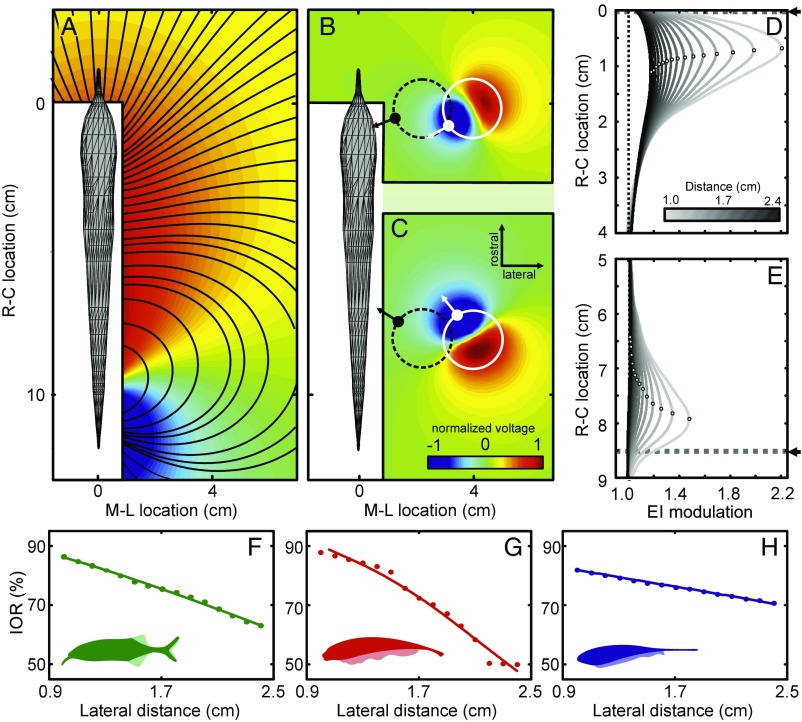
Fig. 1.
Physical basis of electrosensory motion parallax. (A) Top view of the basal electric field of Gnathonemus petersii computed using a boundary element method (BEM) electric field model (Materials and Methods). Normalized voltage is shown as a color map (red, positive and blue, negative); electric field lines are indicated by black contours. The white areas close to the fish comprise points where data could not be obtained in the corresponding physical measurements (Fig. S2). (B and C) Electric field perturbations due to a metal sphere (1-cm radius) positioned at two different rostral–caudal locations (B, rostral; C, caudal) and a lateral distance of 2.9 cm. The field perturbation (plotted as normalized voltage; see color bar) is defined as the difference between the electric field with and without the object present. The position and size of the sphere is indicated by the white circle. The polarization gradient of the object (white arrows) is roughly aligned with the field lines of the unperturbed field (see black contour lines in A). Accordingly, the gradient differs by almost 90° for the rostral and the caudal object. The dashed black circles represent the spheres at a distance of 1.1 cm from the fish with the corresponding polarization gradient shown by the black arrows. At this closer lateral distance, the angular difference of the polarization gradients is smaller than when the object is further away (white circles, see also Fig. S1). (D and E) Electric images (EIs) of the sphere at different lateral distances (1–2.4 cm; see grayscale bar) for the same rostral–caudal positions as in B and C, respectively. The location of the object along the rostral–caudal axis is indicated by the dashed lines in both panels (fish mouth at x = 0 cm). Note that the amplitude of the EI decreases with increasing lateral distance, while the EI peak (open circles) shifts toward the midbody. (F–H) The image–object ratio (IOR) measured using BEM electric field models for three different species. The IOR is the ratio (in percentage) of the shift of the EI peak (Δimage) to the actual physical displacement of the object (Δobject) for the two rostral–caudal object locations shown in B and C. The IOR decreased with distance in all cases, suggesting that a more distant object would appear to be moving slower during relative motion. Solid lines show power law fits to the measurements: root-mean-square error (RMSE) Gnathonemus petersii (green) 0.38%, Apteronotus albifrons (red) 1.82%, and Eigenmannia virescens (blue) 0.14%.

