Fig. 2.
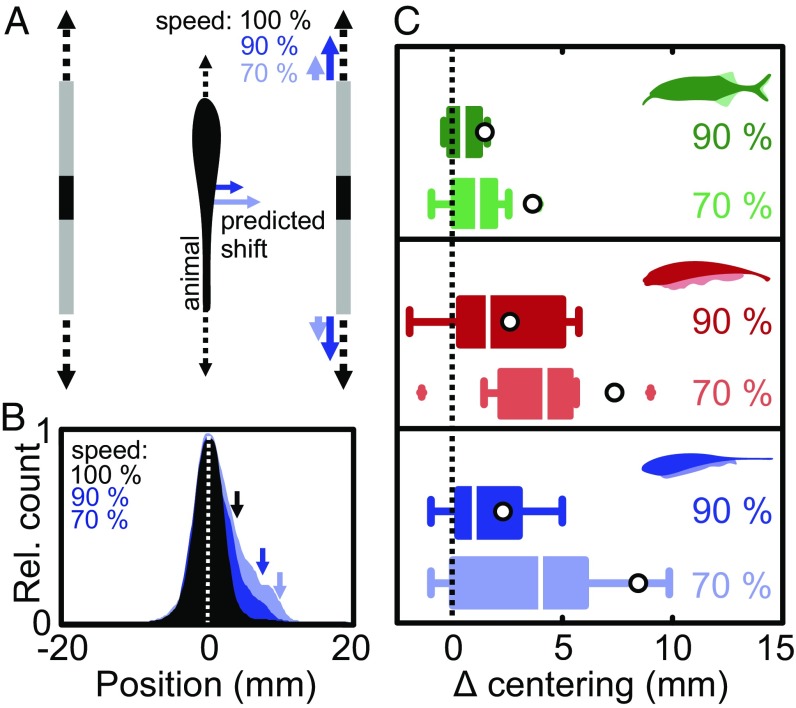
Behavioral test of the electrosensory parallax hypothesis. (A) Schematic drawing of the behavioral setup: Top view of a fish positioned between the moving shuttle walls (gray) with a slit (black) acting as a conductive object. Control condition: both sides move back and forth in phase at 2 cm⋅s−1 (dashed black arrows; Materials and Methods). Parallax conditions: one side (Left) moving at 2 cm⋅s−1 and the other (Right) moving in phase at 1.8 cm⋅s−1 (90% speed, blue) or 1.4 cm⋅s−1 (70% speed, light blue). The colored arrows beside the fish indicate the predicted change in centering for each condition under the assumption that electrosensory parallax is used to estimate lateral distance. (B) Normalized distributions of fish position during centering behavior in Eigenmannia: control condition (n = 21, black), 90% speed (n = 11, dark blue), and 70% speed (n = 10, light blue). Note that for illustrative purposes the position data were adjusted to represent the parallax condition on the Right, while the experimental conditions were tested on either side at random. With a stronger parallax cue, the skewness of the position distributions increased as quantified by the 90% quantiles (see arrows). (C) Behavioral change in centering for the three species tested (green, G. petersii; red, A. albifrons; and blue, E. virescens). We quantified the behavioral responses as the change in position of the 90% quantile of the position distributions between control and parallax conditions (Δ centering); boxplots show shift in position; median, interquartile range (bars), 1.5 times the interquartile range (whiskers), and outliers (+). For each species, we found a significant shift toward the slower side [Wilcoxon signed-rank test, G. petersii: (90%) n = 10, P = 0.04; (70%) n = 9, P = 0.02; A. albifrons: (90%) n = 9, P = 0.03; (70%) n = 9, P = 0.01; E. virescens: (90%) n = 11 fish, P = 0.02; (70%) n = 10 fish, P = 0.03)]. Open circles represent the predictions of the perceptual shuttle center during parallax conditions based on our EI simulations for each species (Supporting Information and Fig. S4).

