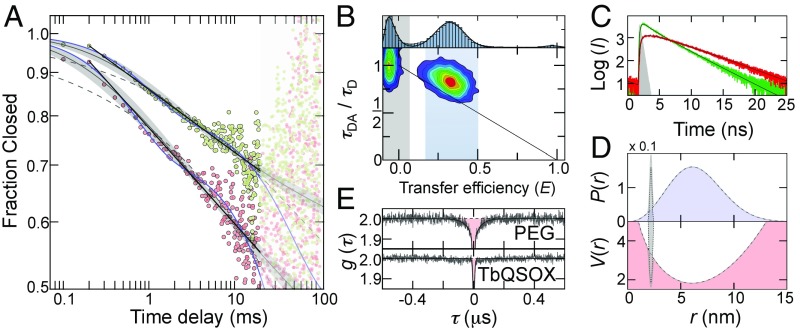
Fig. 2.
Power-law kinetics and heterogeneity detected with smFRET. (A) Time decay of the closed population corrected for the arrival of new molecules with (red circles) and without (green circles) 1 mM DTT. Weighted fits with a power law (black lines), Eq. 2 (gray lines) with a 95% CI (gray shading), a stretched exponential fit with Eq. 3 (gray dashed lines), and a double exponential fit with the COO-model (blue lines) are shown for comparison. Data points >20 ms were excluded from the fit. (B) FRET histogram (Top) and 2D correlation map between donor fluorescence lifetime and transfer efficiency in the absence of substrate. The solid line shows the dependence for a single donor-acceptor distance. The blue region indicates molecules selected for the fluorescence lifetime analysis shown in C. (C) Subpopulation-specific fluorescence intensity (I) decays for donor (green) and acceptor (red) of open TbQSOX. Black lines are global fits based on the distance distribution in Eq. 4 (SI Appendix). The instrumental response function is shown in gray. (D) Distance distribution (Top) and free energy potential in units of kBT (Bottom) of open TbQSOX (black dashed line) resulting from the fits in C. An estimate of the closed distribution based on the X-ray structure of TbQSOX (34) is shown for comparison (dotted lines). (E) Normalized donor-acceptor cross-correlation functions for doubly labeled PEG 5000 (Top) and TbQSOX in the absence of substrate (Bottom). Black lines are fits with a product of exponential functions (SI Appendix).

