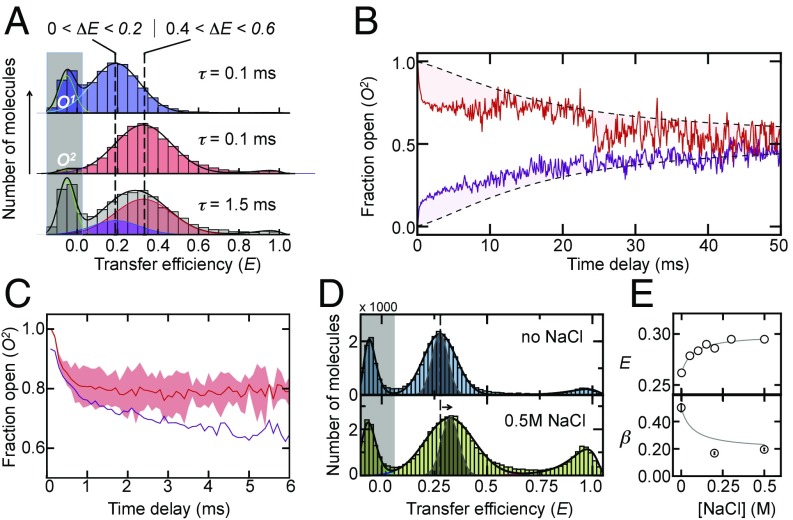
Fig. 3.
Slow exchange within the open state detected with RASP. (A) Single-molecule recurrence histograms of the open populations, O1 (blue) and O2 (red), at different delay times (indicated). The Bottom shows the amount of O1 (blue) that is formed 1.5 ms after starting with 100% O2 (red). The transfer efficiency ranges for the selection of O1 (Left) and O2 (Right) are indicated. Solid lines are fits to a sum of Gaussian functions. (B) Time course of the fraction of O2 after initial selection of molecules from O1 (purple) and O2 (red). Black dashed lines indicate the kinetics in the absence of conformation switching due to the arrival of new molecules. (C) Time course of the fraction of O2 corrected for the arrival of new molecules (red) in comparison with the decay of the closed population (purple). The red-shaded area is the error resulting from averaging the kinetics in B. (D) Transfer efficiency histograms in the absence (Top) and presence (Bottom) of NaCl. The gray-shaded distribution indicates the expected distribution based on photon noise. (E) Mean transfer efficiencies (Top) and β-exponents (Bottom) as a function of the salt concentration. The solid line is an empirical fit. RASP, recurrence analysis of single particles.

