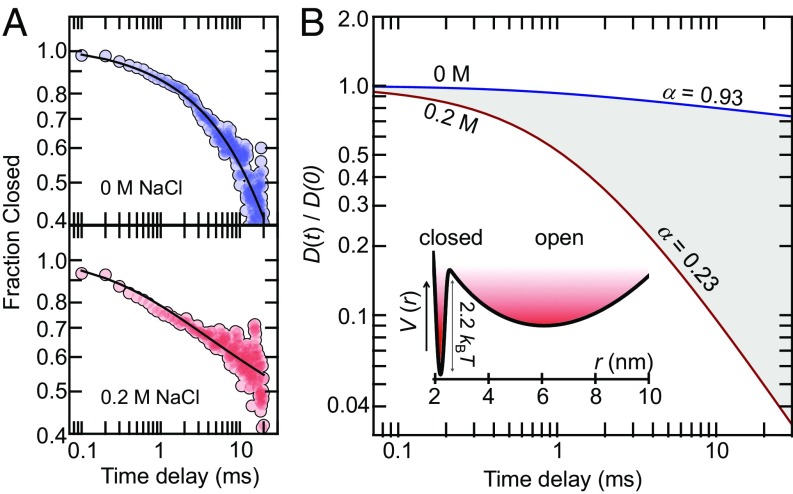
Fig. 4.
Estimate of the relative diffusion coefficients for opening and closing at low and high salt concentrations. (A) Experimental decays (circles) at 0 M NaCl (Top) and 0.2 M NaCl (Bottom) are shown in comparison with fits (black lines) using the numerical solution of the fractional Brownian motion model (Eq. 5) with the empirical relationship . The fit results in b = 1.52 ms−1 and c = −0.08 at 0 M NaCl and b = 0.89 ms−1 and c = −1.03 at 0.2 M NaCl. (B) Time dependence of the relative diffusion coefficients at 0 M NaCl (blue) and 0.2 M NaCl (red), obtained from the fits shown in A. The apparent power-law exponents α (in the text) in the region from 1 ms to 20 ms are indicated in the figure. (Inset) Estimated free energy potential along the experimental distance coordinate (SI Appendix).

