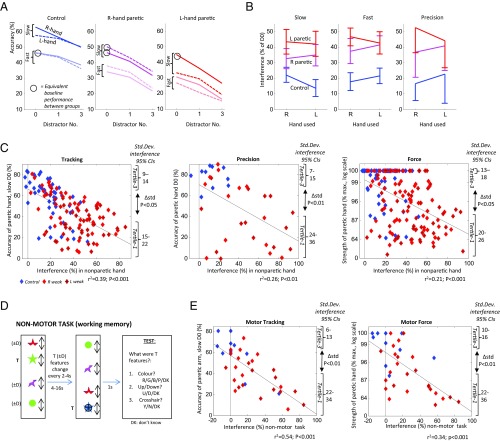
Fig. 2.
(A) Accuracy as a function of distractor number, in slow and fast versions of tracking, in right and left hands. Line gradients—i.e., distractibility—are steeper in patients in both hands, relative to controls, even when matching groups for baseline accuracy (circled), indicating that higher interference is not secondary to poorer performance. L, left; R, right. (B) Normalized interference values (i.e., performance decrement with 3 vs. 0 distractors), with slow and fast tracking, and precision. The interference increases in patients relative to controls are similar comparing hands and tasks (P > 0.05). (C) Scatterplots of paretic-hand motor performance versus normalized interference measured in nonparetic hand, in tracking and precision [both without distractors (D0)], and force. As well as showing negative correlations for all three tasks (P < 0.001), asymmetric dissociations are also observed for all three (seen as outliers in bottom-left but not top-right of each graph). This is also demonstrated as significantly higher variance of interference values in lowest versus highest performance tertiles (P < 0.05), or by the residuals of the regression lines shown getting progressively smaller with better paretic-arm performance (r = −0.21, −0.24; P < 0.05; tracking and force). Regression lines shown (also in E). (D) Nonmotor version of tracking required subjects to watch a moving target T, whose features changed every 2–4 s, before being probed on T’s last features. On half of trials, they ignored three distractors (D). Interference is quantified as the recall accuracy without distractors, minus accuracy with distractors. B, blue; D, down; G, green; N, no; P, pink; R, red; U, up; Y, yes. (E) Scatterplots of normalized interference on nonmotor task versus motor-tracking or force performance. Asymmetric dissociations are observed once again. Std. Dev., standard deviation.

