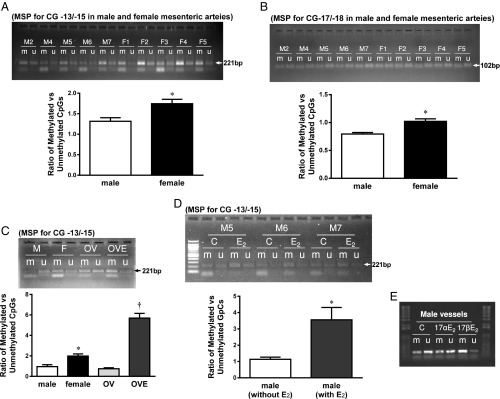
Fig. 3.
Original tracing and summarized data from MSP showing the ratio of methylated (m) to unmethylated (u) CG −13/−15 (A and C–E) and CG −17/−18 (B) in mesenteric arteries isolated from male (M) and female (F) mice (A and B), female mice with OV, and OVE (C), and male vessels treated with and without 10 nM 17β-E2 (D and E) or 17α-E2 (E). *Significant difference from male and OV. †Significant difference from male, female and OV (n = 4–6 for each group, except for E).

